System Pressure
Overview
DynamiSpectra provides an analytical tool to evaluate pressure profiles across molecular dynamics simulations using .xvg files. The module calculates the mean pressure from multiple replicates and displays a time series plot with the standard deviation as a shaded region, helping to assess stability and fluctuations over time.
In addition to ensemble analysis, DynamiSpectra supports individual plots for each replicate and generates kernel density plots to visualize the distribution of pressure values. These outputs offer insight into system equilibrium, variability between replicates, and potential instabilities during the simulation.
Command line in GROMACS to generate .xvg files for the analysis:
gmx energy -f Simulation.edr -o pressure_simulation.xvg
def pressure_analysis(output_folder, *simulation_file_groups, pressure_config=None, density_config=None)
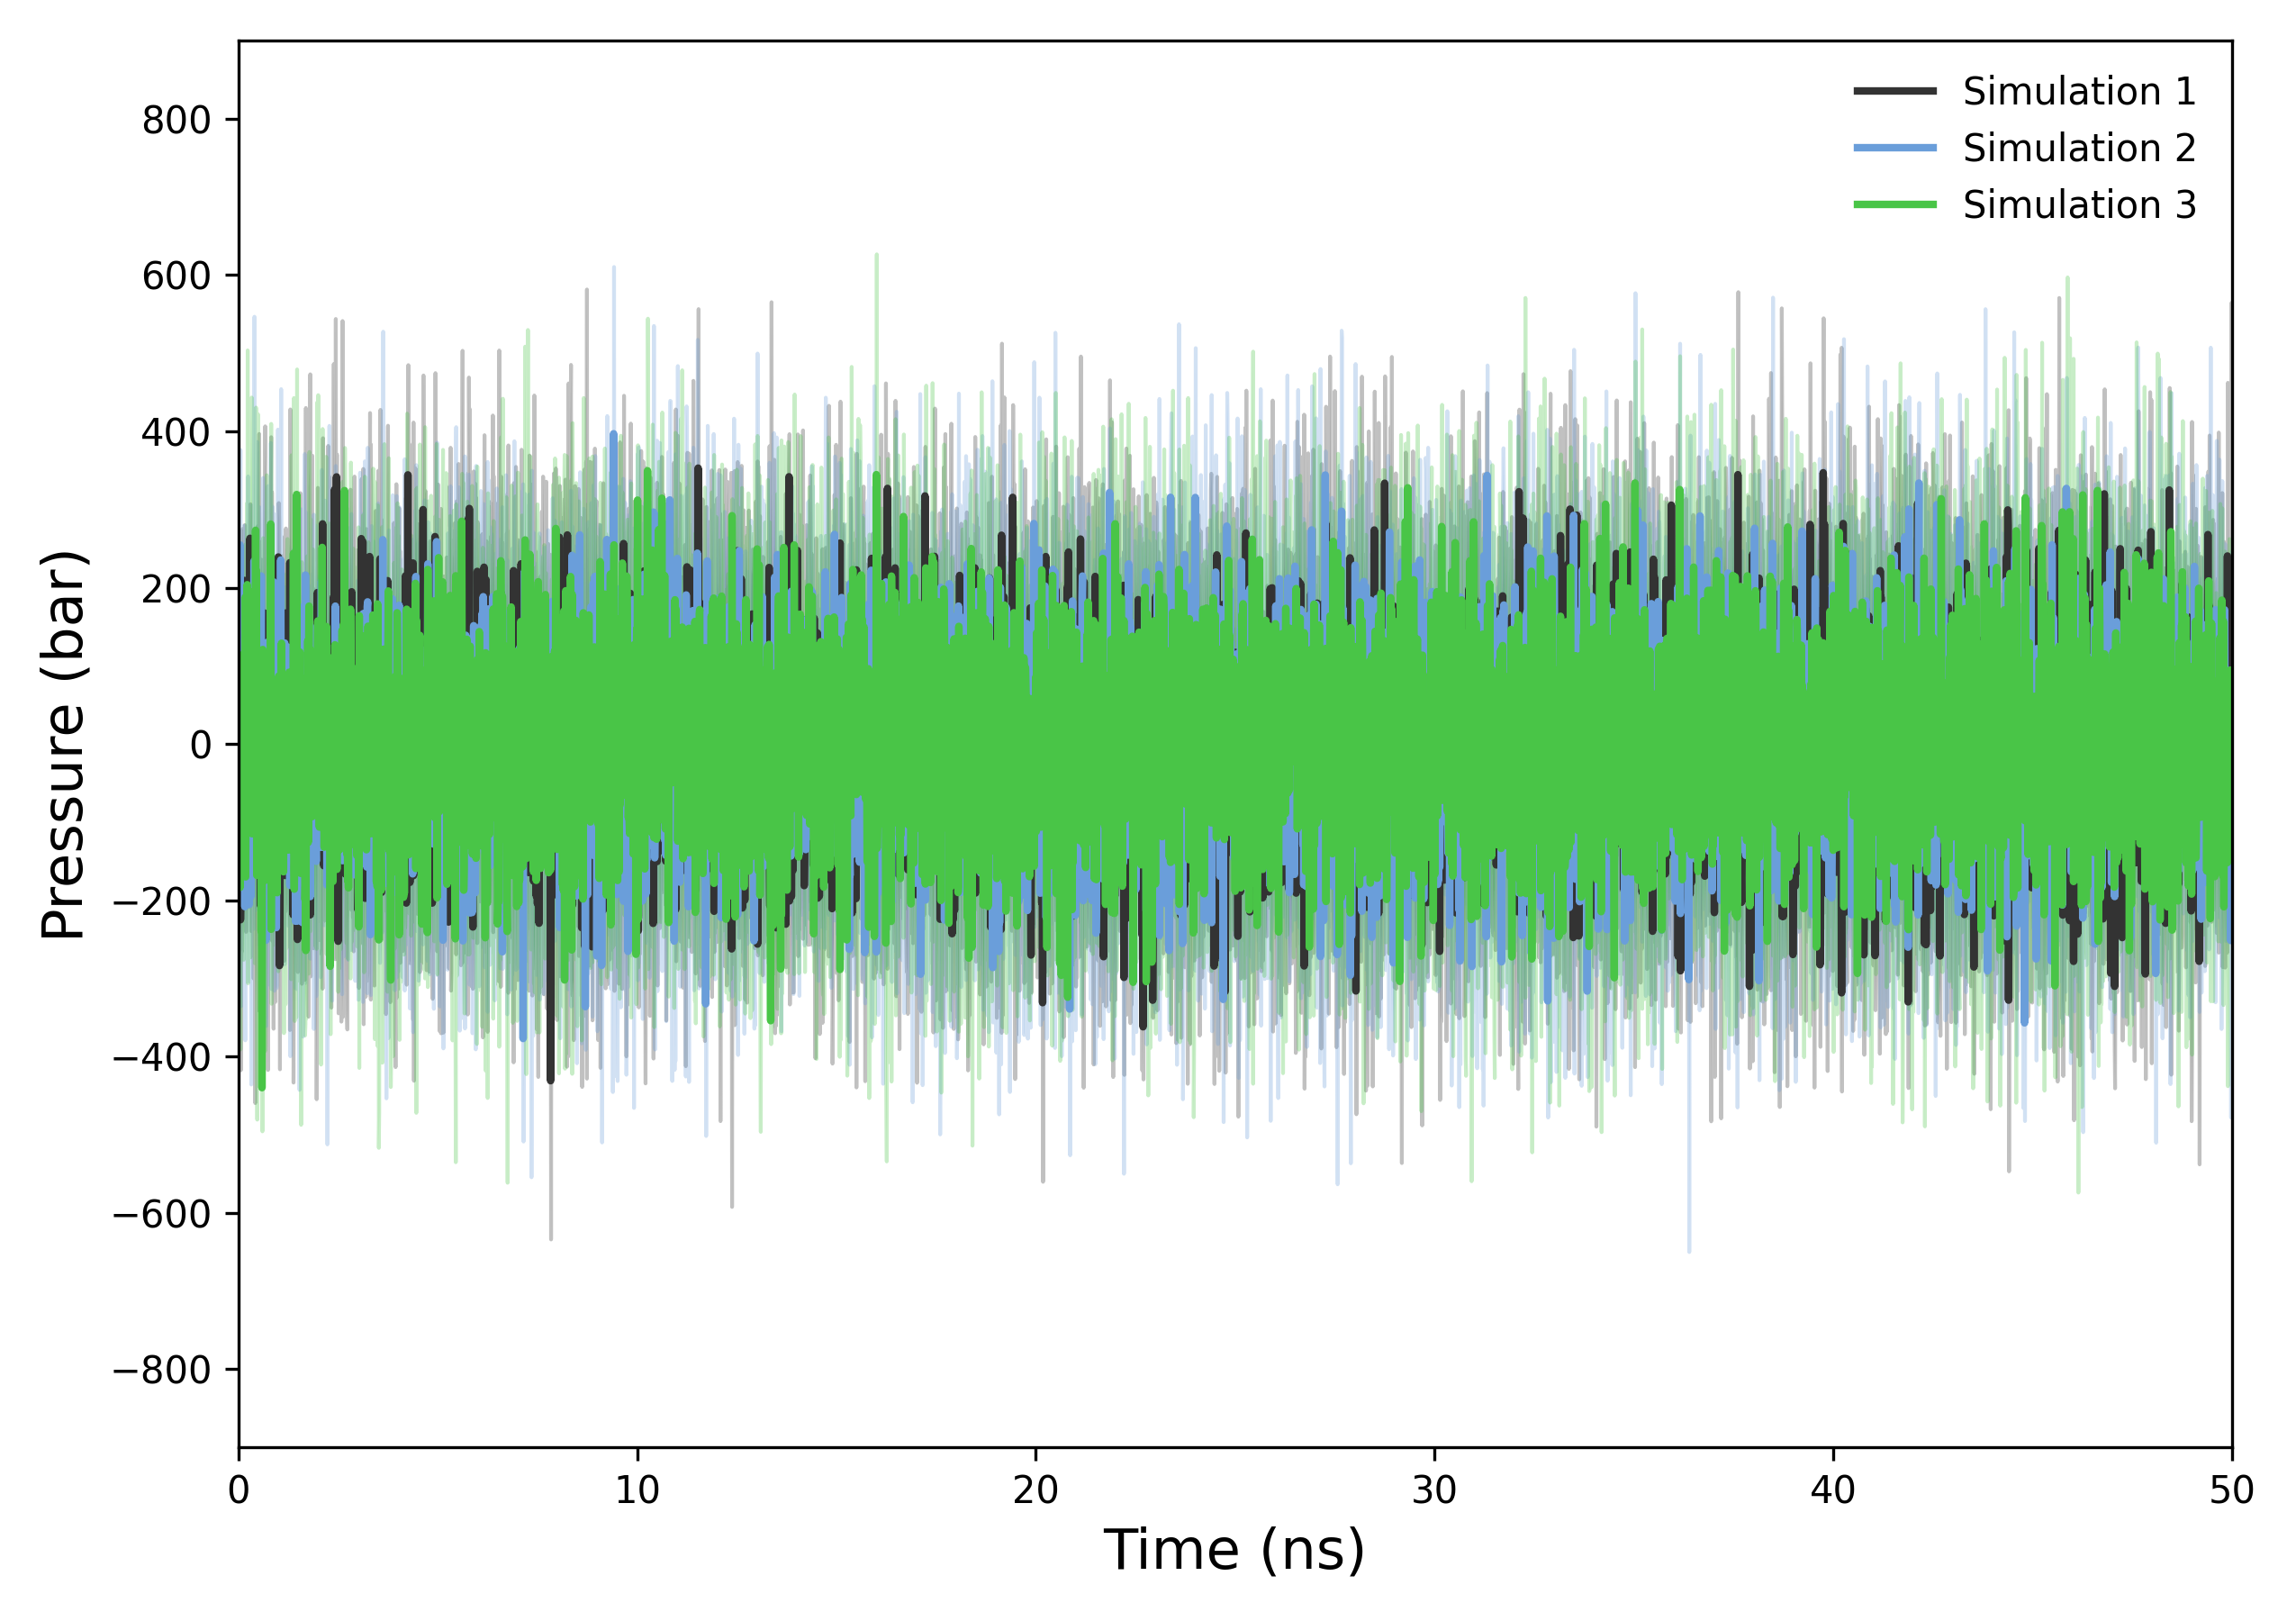
Interpretation guidance: The resulting plots illustrate the temporal evolution of system pressure. A stable pressure profile over time suggests that the system has reached equilibrium and is maintaining consistent thermodynamic conditions. In contrast, large fluctuations or drifts may indicate issues with system stability, improper equilibration, or external perturbations influencing the simulation dynamics.
def plot_pressure_density(results, output_folder, config=None)
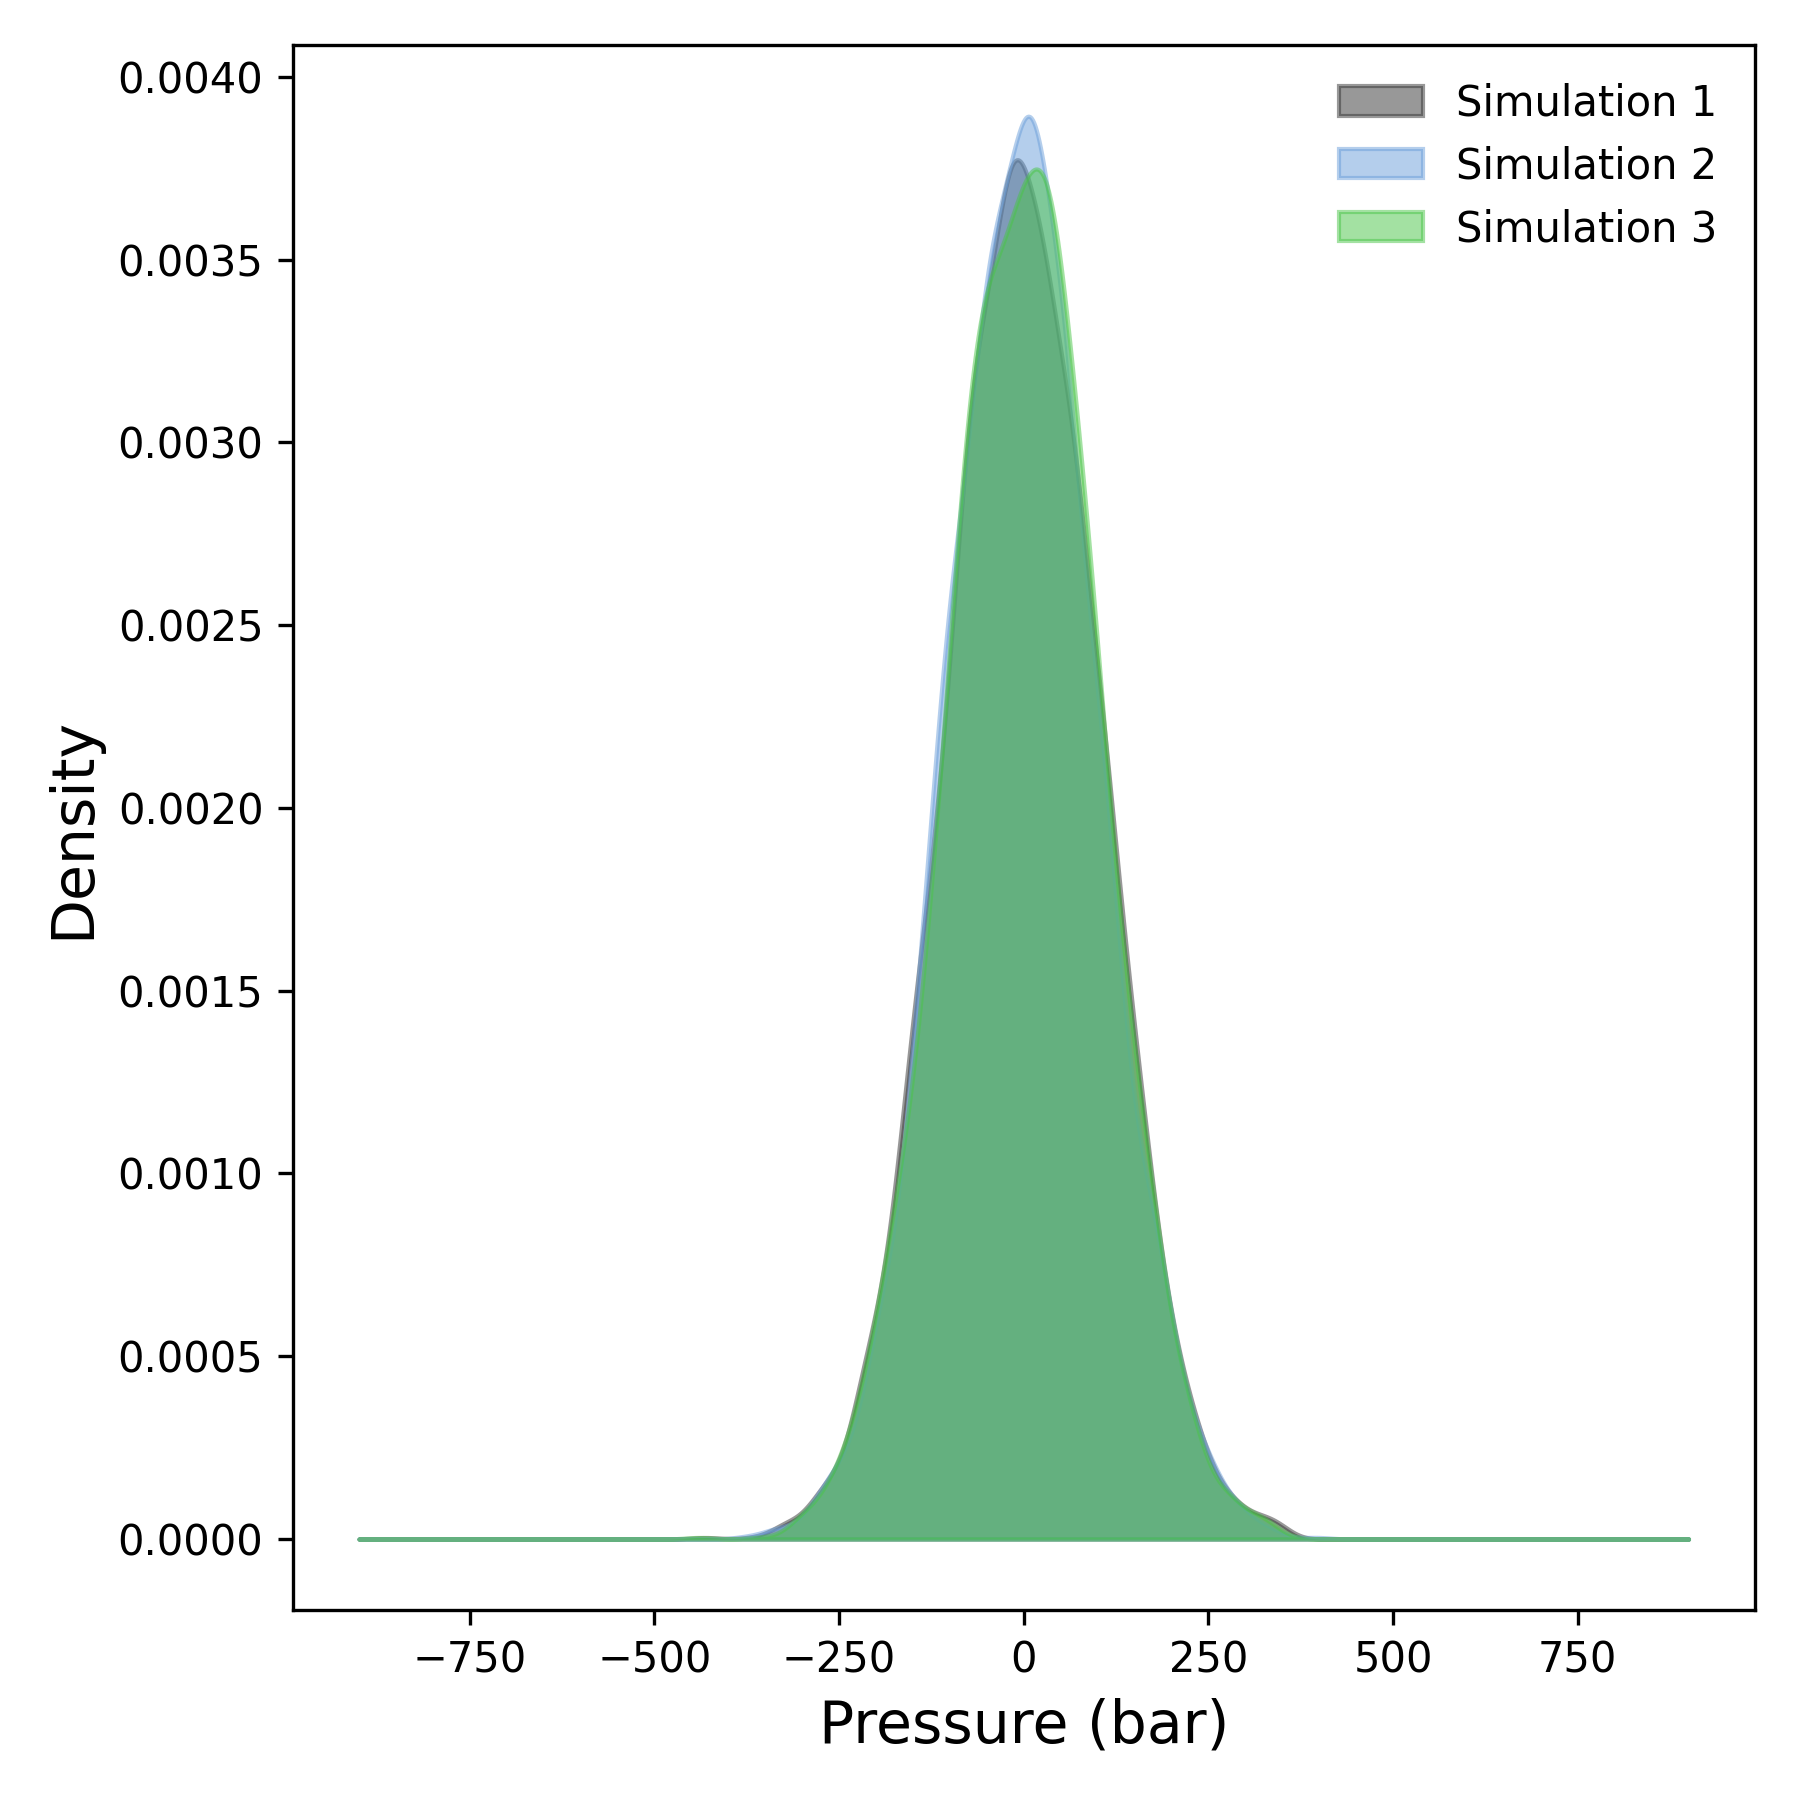
Interpretation guidance: This plot represents the pressure distribution derived from the temporal profile of system pressure. Peaks in the distribution indicate frequently sampled pressure values, reflecting the most common thermodynamic states of the system. Broader peaks suggest greater variability or fluctuations in pressure, while sharper, well-defined peaks indicate stable and consistent pressure throughout the simulation.
Complete code
import numpy as np
import matplotlib.pyplot as plt
from scipy.stats import gaussian_kde
import os
def read_pressure(file):
"""
Reads pressure data from a .xvg file.

Parameters:
-----------
file : str
    Path to the .xvg pressure data file.

Returns:
--------
times : np.ndarray
    Time points converted from picoseconds to nanoseconds.
pressures : np.ndarray
    Corresponding pressure values in bar.
"""
try:
    times = []
    pressures = []
    with open(file, 'r') as f:
        for line in f:
            # Skip comment or empty lines
            if line.startswith(('#', '@', ';')) or line.strip() == '':
                continue
            try:
                values = line.split()
                if len(values) >= 2:
                    time_ps, pressure_val = map(float, values[:2])
                    times.append(time_ps / 1000.0)  # Convert ps to ns
                    pressures.append(pressure_val)
            except ValueError:
                # Ignore lines with parsing errors
                continue
    if len(times) == 0 or len(pressures) == 0:
        raise ValueError(f"File {file} does not contain valid data.")
    return np.array(times), np.array(pressures)
except Exception as e:
    print(f"Error reading file {file}: {e}")
    return None, None
def check_simulation_times(*time_arrays):
"""
Checks that all simulation time arrays match closely.

Parameters:
-----------
time_arrays : list of np.ndarray
    Variable number of time arrays to compare.

Raises:
-------
ValueError if any time arrays differ significantly.
"""
for i in range(1, len(time_arrays)):
    if not np.allclose(time_arrays[0], time_arrays[i]):
        raise ValueError(f"Simulation times do not match between file 1 and file {i+1}")
def plot_pressure(results, output_folder, config=None):
"""
Plots time series of mean pressure with shaded standard deviation.

Parameters:
-----------
results : list of tuples
    Each tuple contains (times, mean_pressure, std_pressure) arrays.
output_folder : str
    Directory to save plots.
config : dict, optional
    Plot configuration dictionary for labels, colors, alpha, figure size, axis labels, etc.
"""
plt.figure(figsize=config.get('figsize', (9, 6)))

for idx, (time, mean, std) in enumerate(results):
    label = config['labels'][idx] if config and 'labels' in config else f'Simulation {idx+1}'
    color = config['colors'][idx] if config and 'colors' in config else None
    alpha = config.get('alpha', 0.2)

    # Plot mean pressure line
    plt.plot(time, mean, label=label, color=color, linewidth=2)
    # Fill between mean ± std for shaded error region
    plt.fill_between(time, mean - std, mean + std, color=color, alpha=alpha)

plt.xlabel(config.get('xlabel', 'Time (ns)'), fontsize=config.get('label_fontsize', 12))
plt.ylabel(config.get('ylabel', 'Pressure (bar)'), fontsize=config.get('label_fontsize', 12))
plt.legend(frameon=False, loc='upper right', fontsize=10)
plt.tick_params(axis='both', which='major', labelsize=10)

max_time = max([np.max(time) for time, _, _ in results])
plt.xlim(0, max_time)
if config and 'ylim' in config:
    plt.ylim(config['ylim'])

plt.tight_layout()
os.makedirs(output_folder, exist_ok=True)
plt.savefig(os.path.join(output_folder, 'pressure_plot.tiff'), dpi=300)
plt.savefig(os.path.join(output_folder, 'pressure_plot.png'), dpi=300)
plt.show()
def plot_pressure_density(results, output_folder, config=None):
"""
Plots kernel density estimates (KDE) of the pressure distributions.

Parameters:
-----------
results : list of tuples
    Each tuple contains (times, mean_pressure, std_pressure) arrays.
output_folder : str
    Directory to save plots.
config : dict, optional
    Plot configuration dictionary for labels, colors, alpha, figure size, axis labels, etc.
"""
plt.figure(figsize=config.get('figsize', (6, 6)))

for idx, (_, mean, _) in enumerate(results):
    kde = gaussian_kde(mean)  # Estimate density of mean pressures
    x_min = config.get('x_min', np.min(mean))
    x_max = config.get('x_max', np.max(mean))
    x_vals = np.linspace(x_min, x_max, 1000)

    label = config['labels'][idx] if config and 'labels' in config else f'Simulation {idx+1}'
    color = config['colors'][idx] if config and 'colors' in config else None
    alpha = config.get('alpha', 0.5)

    # Fill area under KDE curve for density plot
    plt.fill_between(x_vals, kde(x_vals), color=color, alpha=alpha, label=label)

plt.xlabel(config.get('xlabel', 'Pressure (bar)'), fontsize=config.get('label_fontsize', 12))
plt.ylabel(config.get('ylabel', 'Density'), fontsize=config.get('label_fontsize', 12))
plt.legend(frameon=False, loc='upper right', fontsize=10)
plt.tight_layout()

os.makedirs(output_folder, exist_ok=True)
plt.savefig(os.path.join(output_folder, 'pressure_density.tiff'), dpi=300)
plt.savefig(os.path.join(output_folder, 'pressure_density.png'), dpi=300)
plt.show()
def pressure_analysis(output_folder, *simulation_file_groups, pressure_config=None, density_config=None):
"""
Main function to analyze pressure data from multiple simulation groups.

Parameters:
-----------
output_folder : str
    Directory to save output plots.
simulation_file_groups : list of lists
    Variable number of simulation groups, each a list of .xvg pressure file paths.
pressure_config : dict, optional
    Configuration for time series pressure plot.
density_config : dict, optional
    Configuration for pressure density KDE plot.
"""
def process_group(file_paths):
    """
    Processes one simulation group of replicate files:
    - Reads time and pressure data
    - Checks time consistency
    - Calculates mean and standard deviation of pressure

    Returns:
    --------
    times : np.ndarray
        Time points (ns).
    mean_pressure : np.ndarray
        Mean pressure values.
    std_pressure : np.ndarray
        Standard deviation of pressure.
    """
    times = []
    pressures = []
    for file in file_paths:
        time, pressure_val = read_pressure(file)
        times.append(time)
        pressures.append(pressure_val)
    check_simulation_times(*times)
    pressures_array = np.array(pressures)
    mean_pressure = np.mean(pressures_array, axis=0)
    std_pressure = np.std(pressures_array, axis=0)
    return times[0], mean_pressure, std_pressure

results = []
for group in simulation_file_groups:
    if group:
        time, mean, std = process_group(group)
        results.append((time, mean, std))

if len(results) >= 1:
    plot_pressure(results, output_folder, config=pressure_config)
    plot_pressure_density(results, output_folder, config=density_config)
else:
    raise ValueError("At least one simulation group is required.")