Radius of gyration
Overview
DynamiSpectra provides a robust analytical tool for evaluating the radius of gyration (Rg) from molecular dynamics simulations using .xvg input files. This module supports the analysis of individual simulation replicas as well as the computation of average Rg values and standard deviations across replicates. Visual outputs include time series plots with shaded variability and Rg density distributions for each simulation group.
This analysis helps monitor the structural compactness and stability of macromolecules over time, offering valuable insight into folding behavior, domain organization, or global conformational changes throughout the simulation.
Command line in GROMACS to generate .xvg files for the analysis:
gmx gyrate -f Simulation.xtc -s Simulation.tpr -o gyrate_simulation.xvg
def rg_analysis(output_folder, *simulation_groups, rg_config=None, density_config=None)
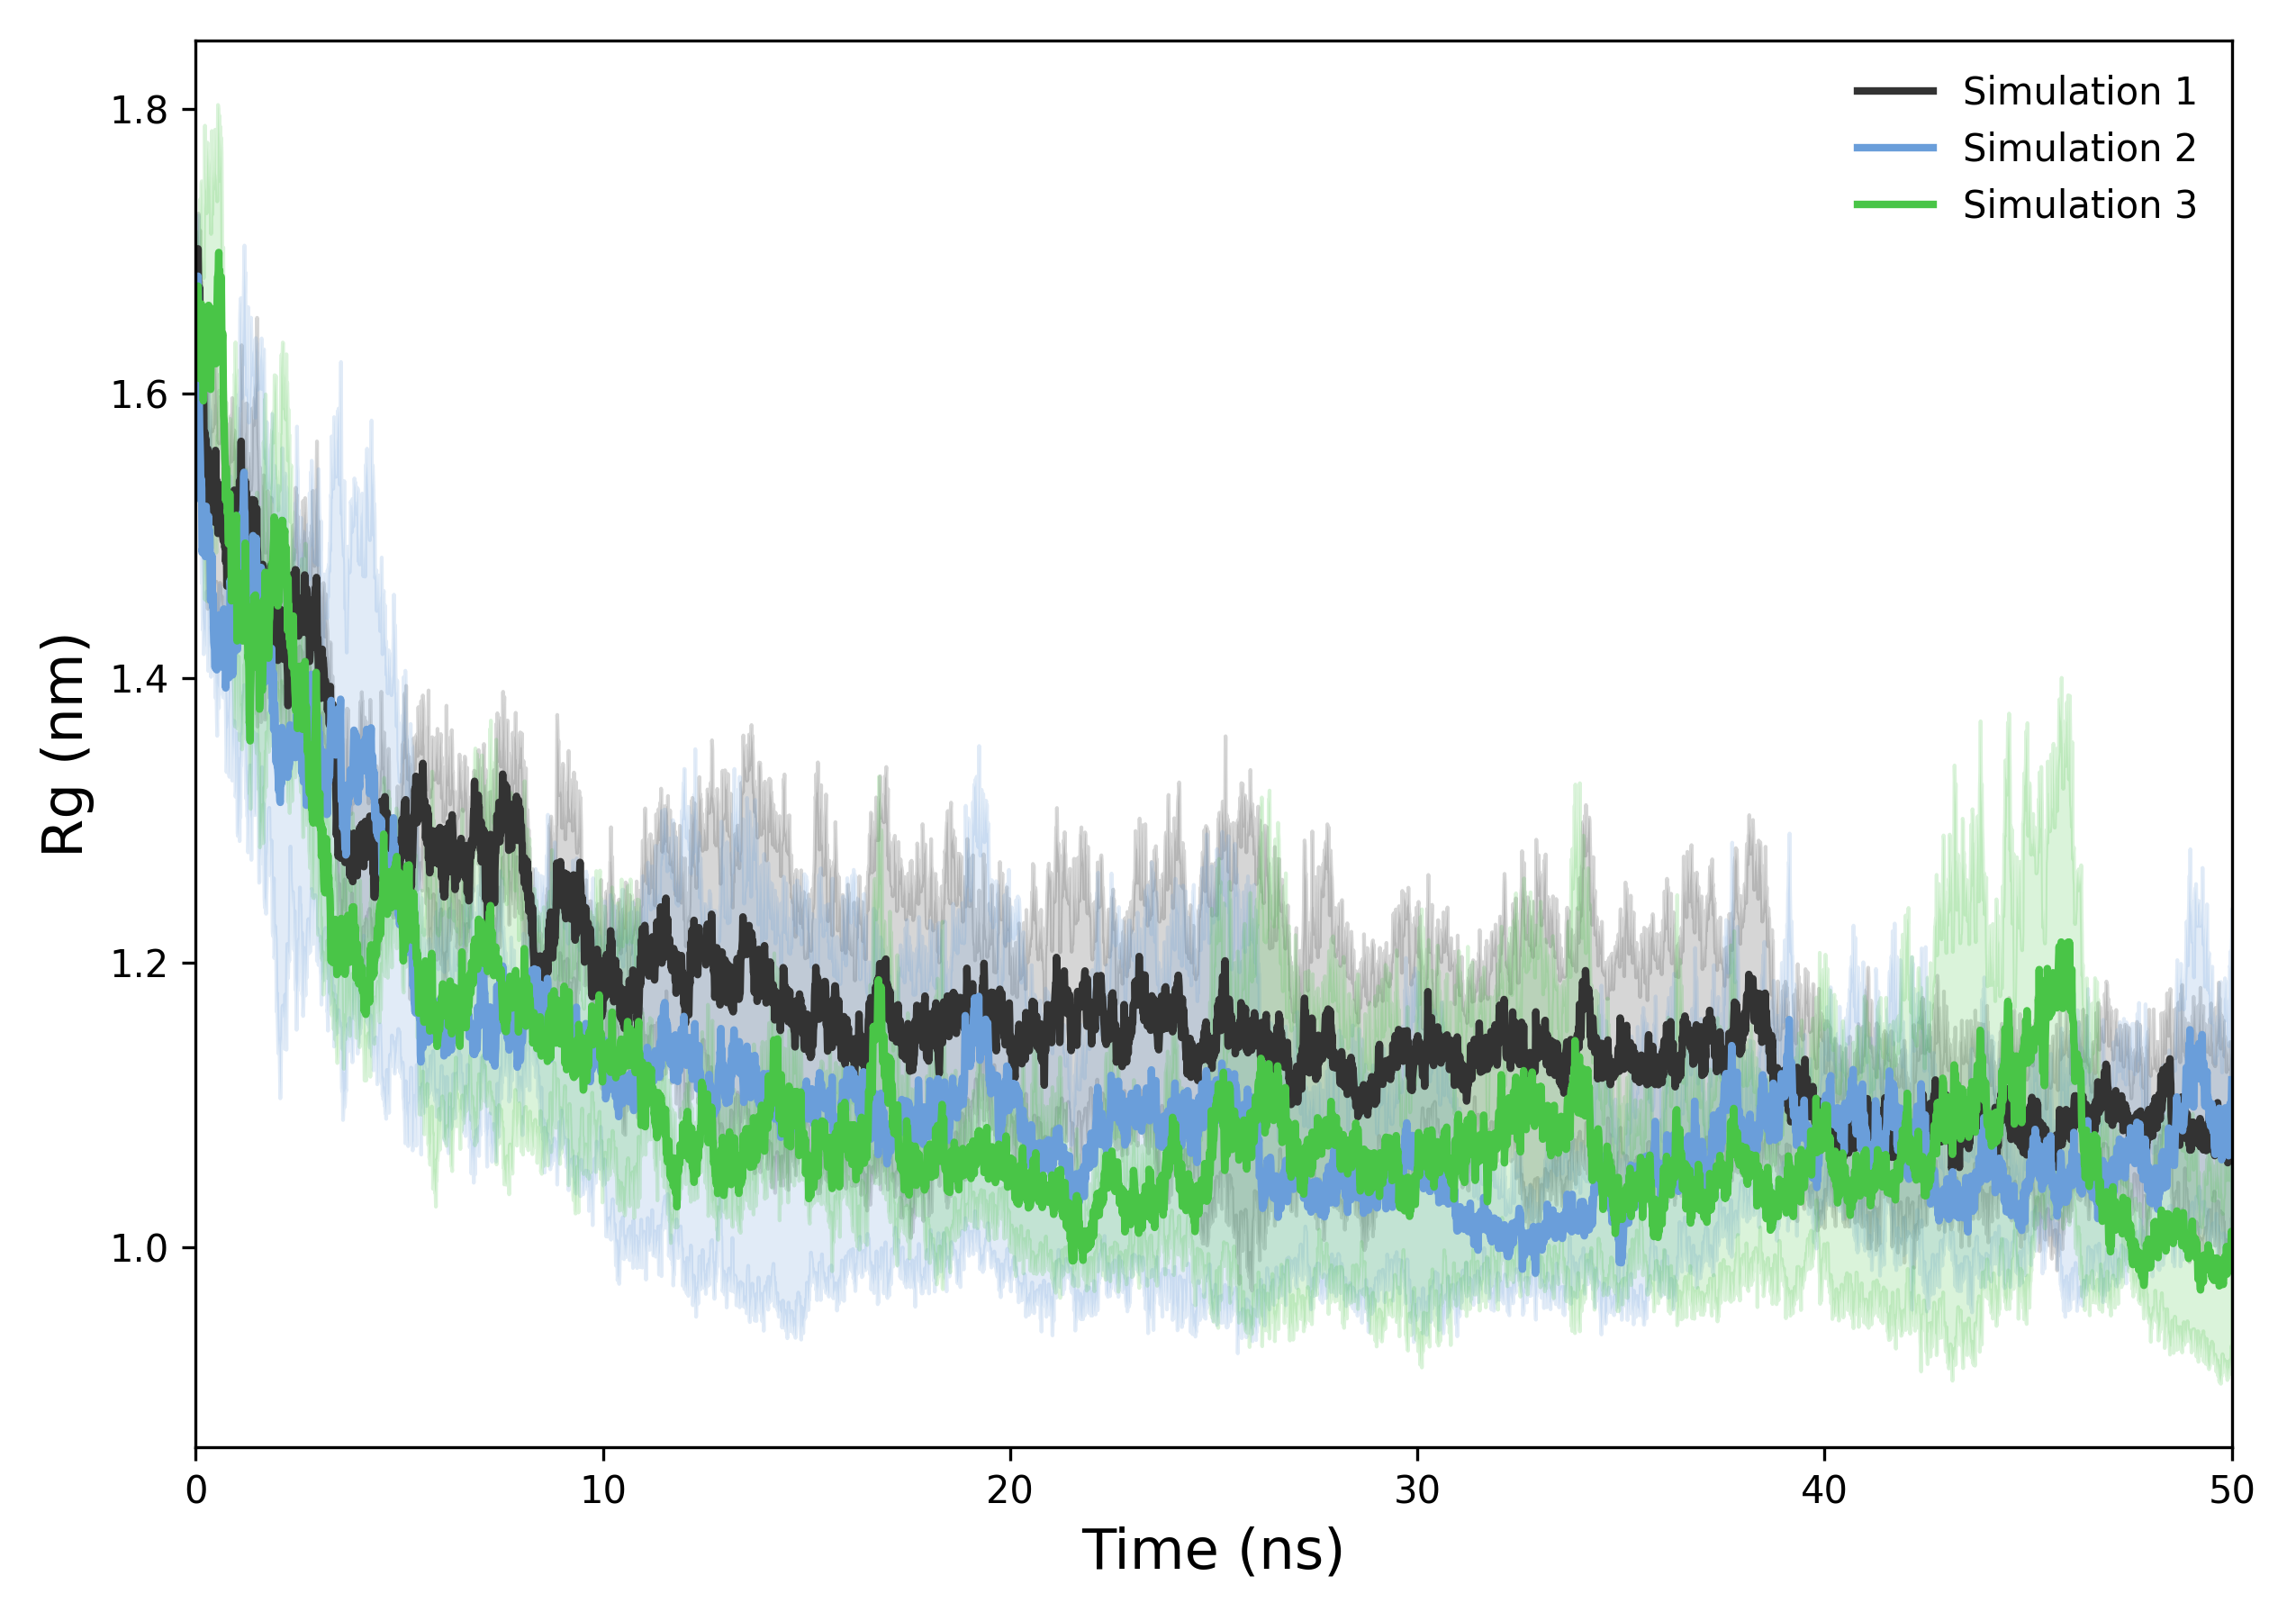
How to interpret: This plot illustrates the evolution of the radius of gyration over time. A stable or consistent Rg profile indicates that the system maintains a compact and well-defined structure throughout the simulation. In contrast, marked increases or decreases in Rg may reflect molecular expansion, unfolding, or compaction. Evaluating Rg trends in relation to expected structural behavior helps determine whether the system’s compactness aligns with its functional or biological role.
def plot_density(results, output_folder, config)
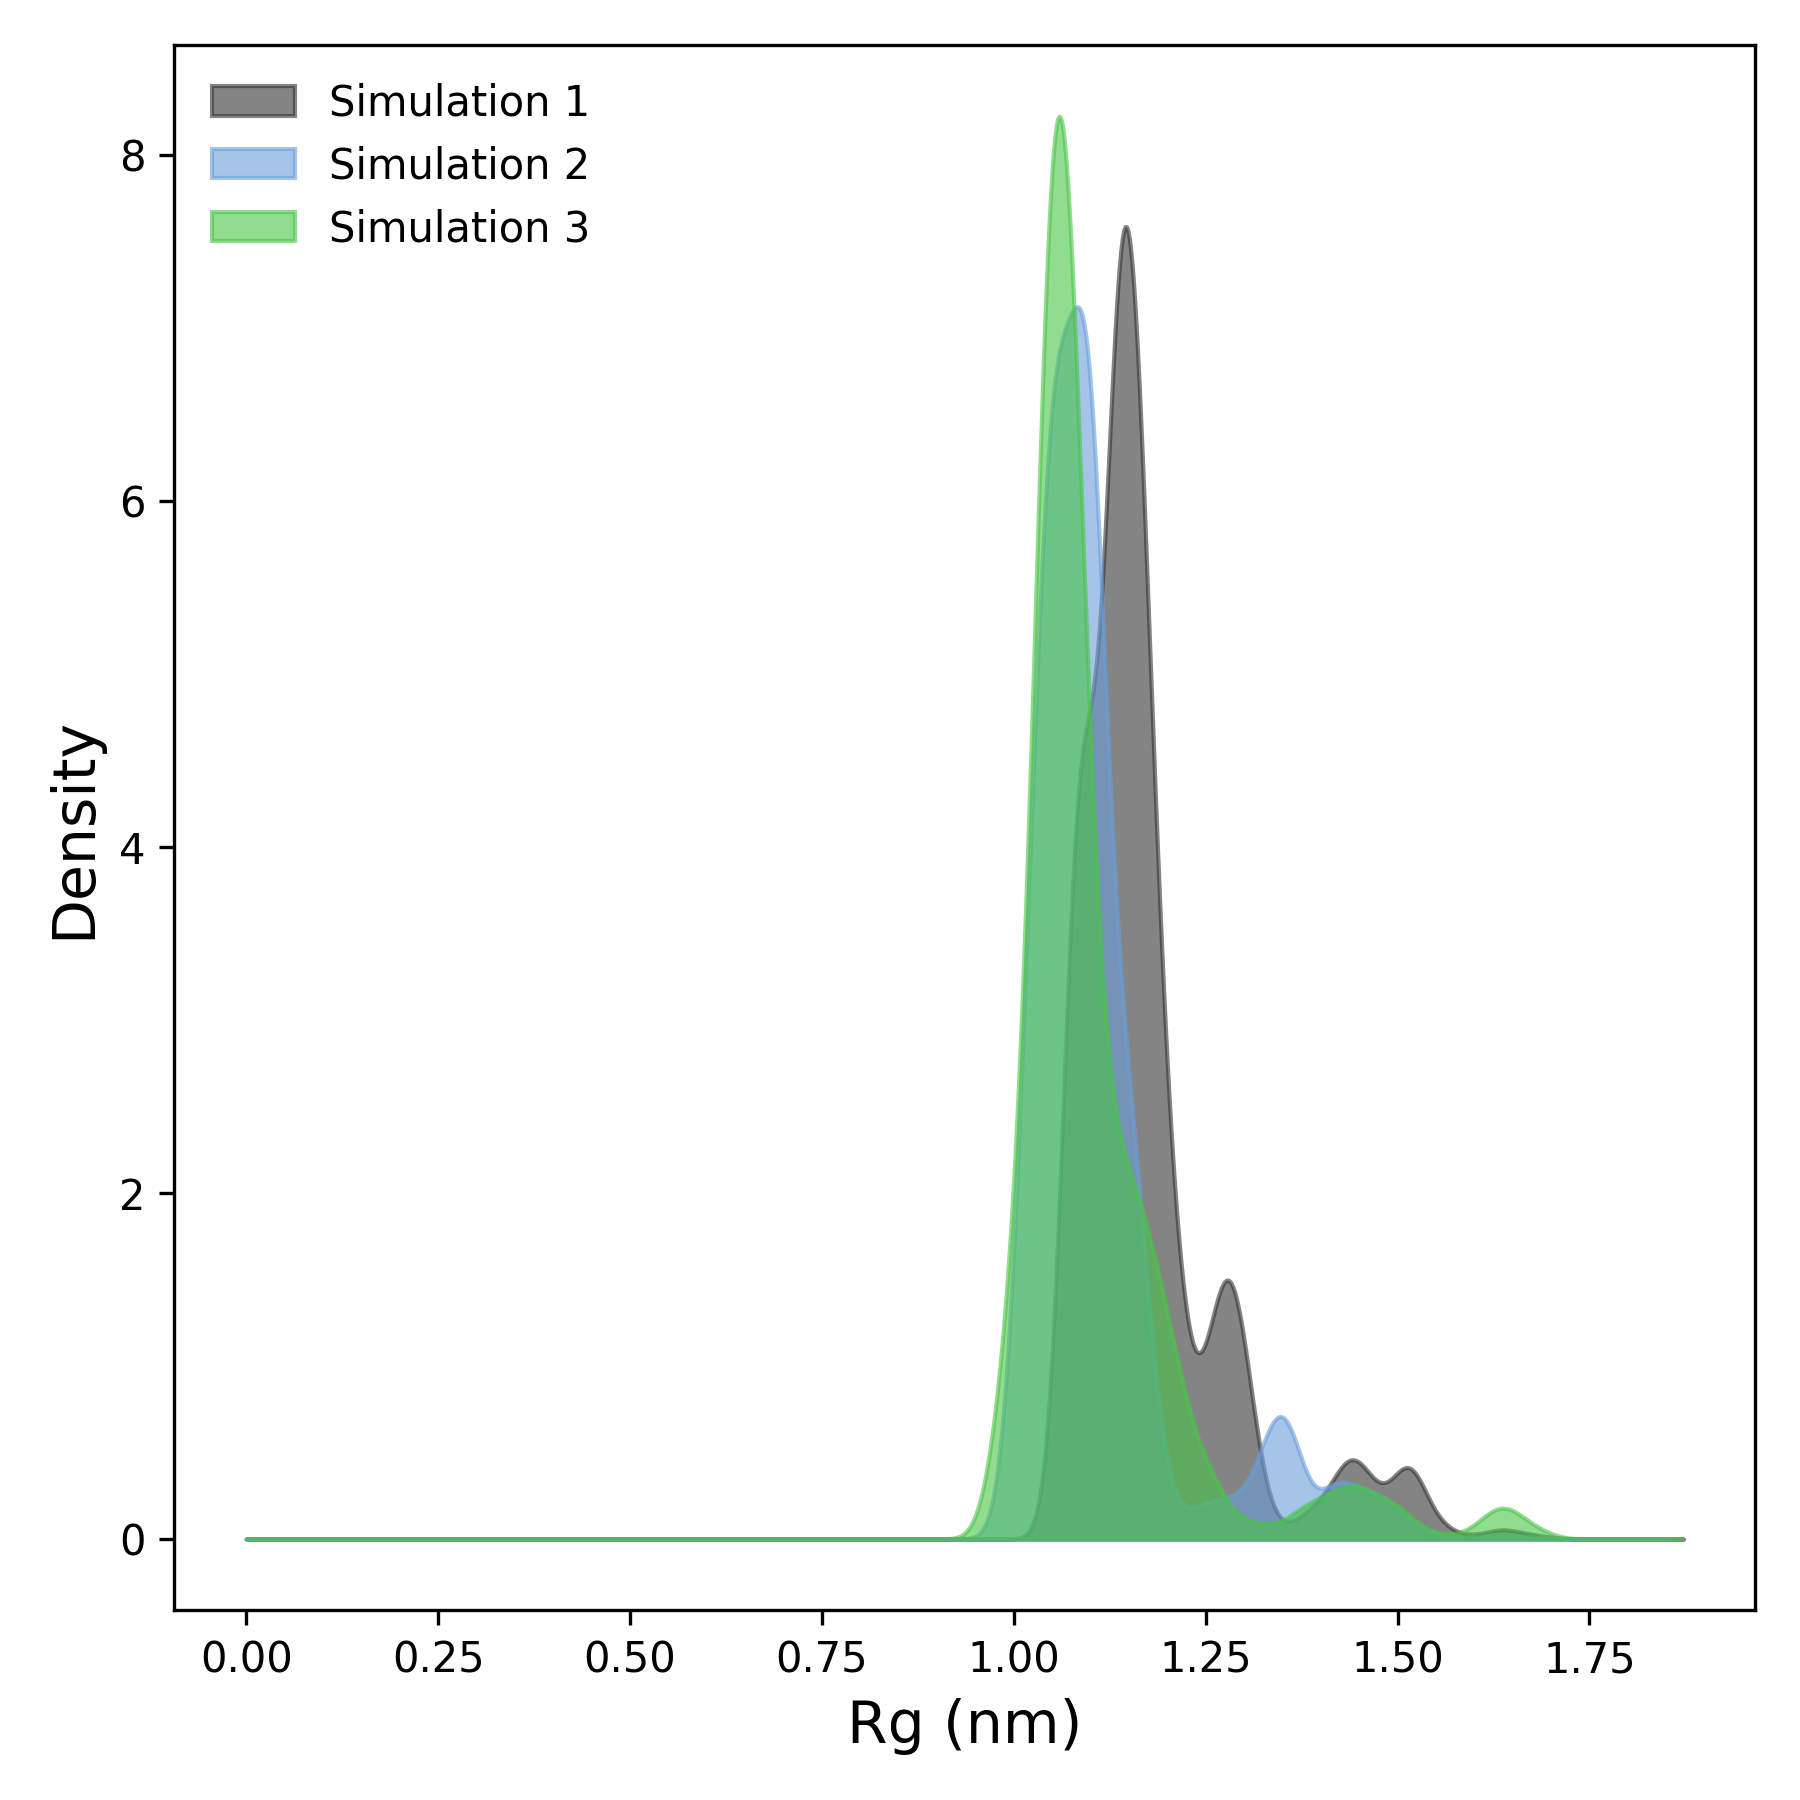
How to interpret: This plot shows the density distribution of the radius of gyration values throughout the simulation. Peaks in the distribution indicate the most frequently sampled Rg values. Sharper, well-defined peaks suggest structural stability and consistency across time or replicates, while broader peaks reflect greater variability in system compactness.
Complete code
import numpy as np
import matplotlib.pyplot as plt
from scipy.stats import gaussian_kde
import os
def read_rg(file):
"""
Reads Radius of Gyration data from a GROMACS .xvg file.
Returns time in nanoseconds and Rg values as numpy arrays.
"""
try:
    print(f"Reading file: {file}")
    times, rg_values = [], []
    with open(file, 'r') as f:
        for line in f:
            if line.startswith(('#', '@', ';')) or line.strip() == '':
                continue
            try:
                values = line.split()
                if len(values) >= 2:
                    time, rg_val = map(float, values[:2])
                    times.append(time / 1000)  # Convert picoseconds to nanoseconds
                    rg_values.append(rg_val)
            except ValueError:
                print(f"Warning: could not parse line: {line.strip()}")
                continue
    if len(times) == 0 or len(rg_values) == 0:
        raise ValueError(f"No valid data found in file: {file}")
    return np.array(times), np.array(rg_values)
except Exception as e:
    print(f"Error reading file {file}: {e}")
    return None, None
def check_simulation_times(*time_arrays):
"""
Checks if all simulation replicates share the same time points.
Raises ValueError if any mismatch is detected.
"""
for i in range(1, len(time_arrays)):
    if not np.allclose(time_arrays[0], time_arrays[i]):
        raise ValueError(f"Simulation times do not match between replicate 1 and replicate {i+1}.")
def plot_rg(results, output_folder, config):
"""
Plots time series of Radius of Gyration (Rg) with mean ± std shading.
Supports any number of simulation groups.
"""
labels = config.get('labels', [f'Simulation {i+1}' for i in range(len(results))])
colors = config.get('colors', plt.cm.get_cmap('tab10').colors)
alpha = config.get('alpha', 0.2)
figsize = config.get('figsize', (7, 6))
xlabel = config.get('xlabel', 'Time (ns)')
ylabel = config.get('ylabel', 'Radius of Gyration (nm)')
label_fontsize = config.get('label_fontsize', 12)
xlim = config.get('xlim', None)
ylim = config.get('ylim', None)

plt.figure(figsize=figsize)

for idx, (time, mean, std) in enumerate(results):
    color = colors[idx % len(colors)]
    plt.plot(time, mean, label=labels[idx], color=color, linewidth=2)
    plt.fill_between(time, mean - std, mean + std, color=color, alpha=alpha)

plt.xlabel(xlabel, fontsize=label_fontsize)
plt.ylabel(ylabel, fontsize=label_fontsize)
plt.legend(frameon=False, loc='upper right', fontsize=10)
plt.tick_params(axis='both', which='major', labelsize=10)

if xlim:
    plt.xlim(xlim)
else:
    max_time = max([t[-1] for t, _, _ in results])
    plt.xlim(0, max_time)

if ylim:
    plt.ylim(ylim)

plt.tight_layout()
os.makedirs(output_folder, exist_ok=True)
plt.savefig(os.path.join(output_folder, 'rg_plot.tiff'), dpi=300)
plt.savefig(os.path.join(output_folder, 'rg_plot.png'), dpi=300)
plt.show()
def plot_density(results, output_folder, config):
"""
Plots kernel density estimates (KDE) of Radius of Gyration distributions
for each simulation group.
"""
labels = config.get('labels', [f'Simulation {i+1}' for i in range(len(results))])
colors = config.get('colors', plt.cm.get_cmap('tab10').colors)
alpha = config.get('alpha', 0.5)
figsize = config.get('figsize', (6, 6))
xlabel = config.get('xlabel', 'Radius of Gyration (nm)')
ylabel = config.get('ylabel', 'Density')
label_fontsize = config.get('label_fontsize', 12)
xlim = config.get('xlim', None)
ylim = config.get('ylim', None)

plt.figure(figsize=figsize)

for idx, (_, mean, _) in enumerate(results):
    kde = gaussian_kde(mean)
    x_min = xlim[0] if xlim else 0
    x_max = xlim[1] if xlim else max(mean) * 1.1
    x = np.linspace(x_min, x_max, 1000)
    color = colors[idx % len(colors)]
    plt.fill_between(x, kde(x), color=color, alpha=alpha, label=labels[idx])

plt.xlabel(xlabel, fontsize=label_fontsize)
plt.ylabel(ylabel, fontsize=label_fontsize)
plt.legend(frameon=False, loc='upper left', fontsize=10)
plt.tick_params(axis='both', which='major', labelsize=10)

if xlim:
    plt.xlim(xlim)
if ylim:
    plt.ylim(ylim)

plt.tight_layout()
os.makedirs(output_folder, exist_ok=True)
plt.savefig(os.path.join(output_folder, 'rg_density.tiff'), dpi=300)
plt.savefig(os.path.join(output_folder, 'rg_density.png'), dpi=300)
plt.show()
def rg_analysis(output_folder, *simulation_groups, rg_config=None, density_config=None):
"""
Main analysis function to process multiple simulation groups with multiple
replicates each. Computes mean and std deviation and plots the results.

Parameters:
- output_folder: directory to save plots
- simulation_groups: variable number of lists, each containing replicate file paths for one simulation group
- rg_config: dict with configuration for Rg time series plot
- density_config: dict with configuration for Rg density plot
"""
if rg_config is None:
    rg_config = {}
if density_config is None:
    density_config = {}

results = []

for group_idx, group_files in enumerate(simulation_groups):
    if not group_files:
        print(f"Warning: Simulation group {group_idx + 1} has no files and will be skipped.")
        continue

    times_list = []
    rg_list = []

    for file in group_files:
        t, rg = read_rg(file)
        if t is None or rg is None:
            raise ValueError(f"Invalid data in file {file}. Please check the file content.")
        times_list.append(t)
        rg_list.append(rg)

    # Check all replicates have matching time points
    check_simulation_times(*times_list)

    mean_rg = np.mean(rg_list, axis=0)
    std_rg = np.std(rg_list, axis=0)
    results.append((times_list[0], mean_rg, std_rg))

if len(results) == 0:
    raise ValueError("No valid simulation groups were provided.")

# Plot results
plot_rg(results, output_folder, rg_config)
plot_density(results, output_folder, density_config)