RMSF
Overview
DynamiSpectra provides a comprehensive Root Mean Square Fluctuation (RMSF) analysis package for molecular dynamics simulations using .xvg input files. The RMSF module supports analysis of individual simulation replicas and computes averages and standard deviations across multiple replicates. The graphical outputs show the average RMSF with a shaded area representing the standard deviation, facilitating visualization of flexibility patterns.
Command line in GROMACS to generate .xvg files for the analysis:
gmx rmsf -f Simulation.xtc -s Simulation.tpr -o Simulation.xvg -res
def rmsf_analysis(output_folder, *simulation_files_groups, rmsf_config=None, density_config=None)
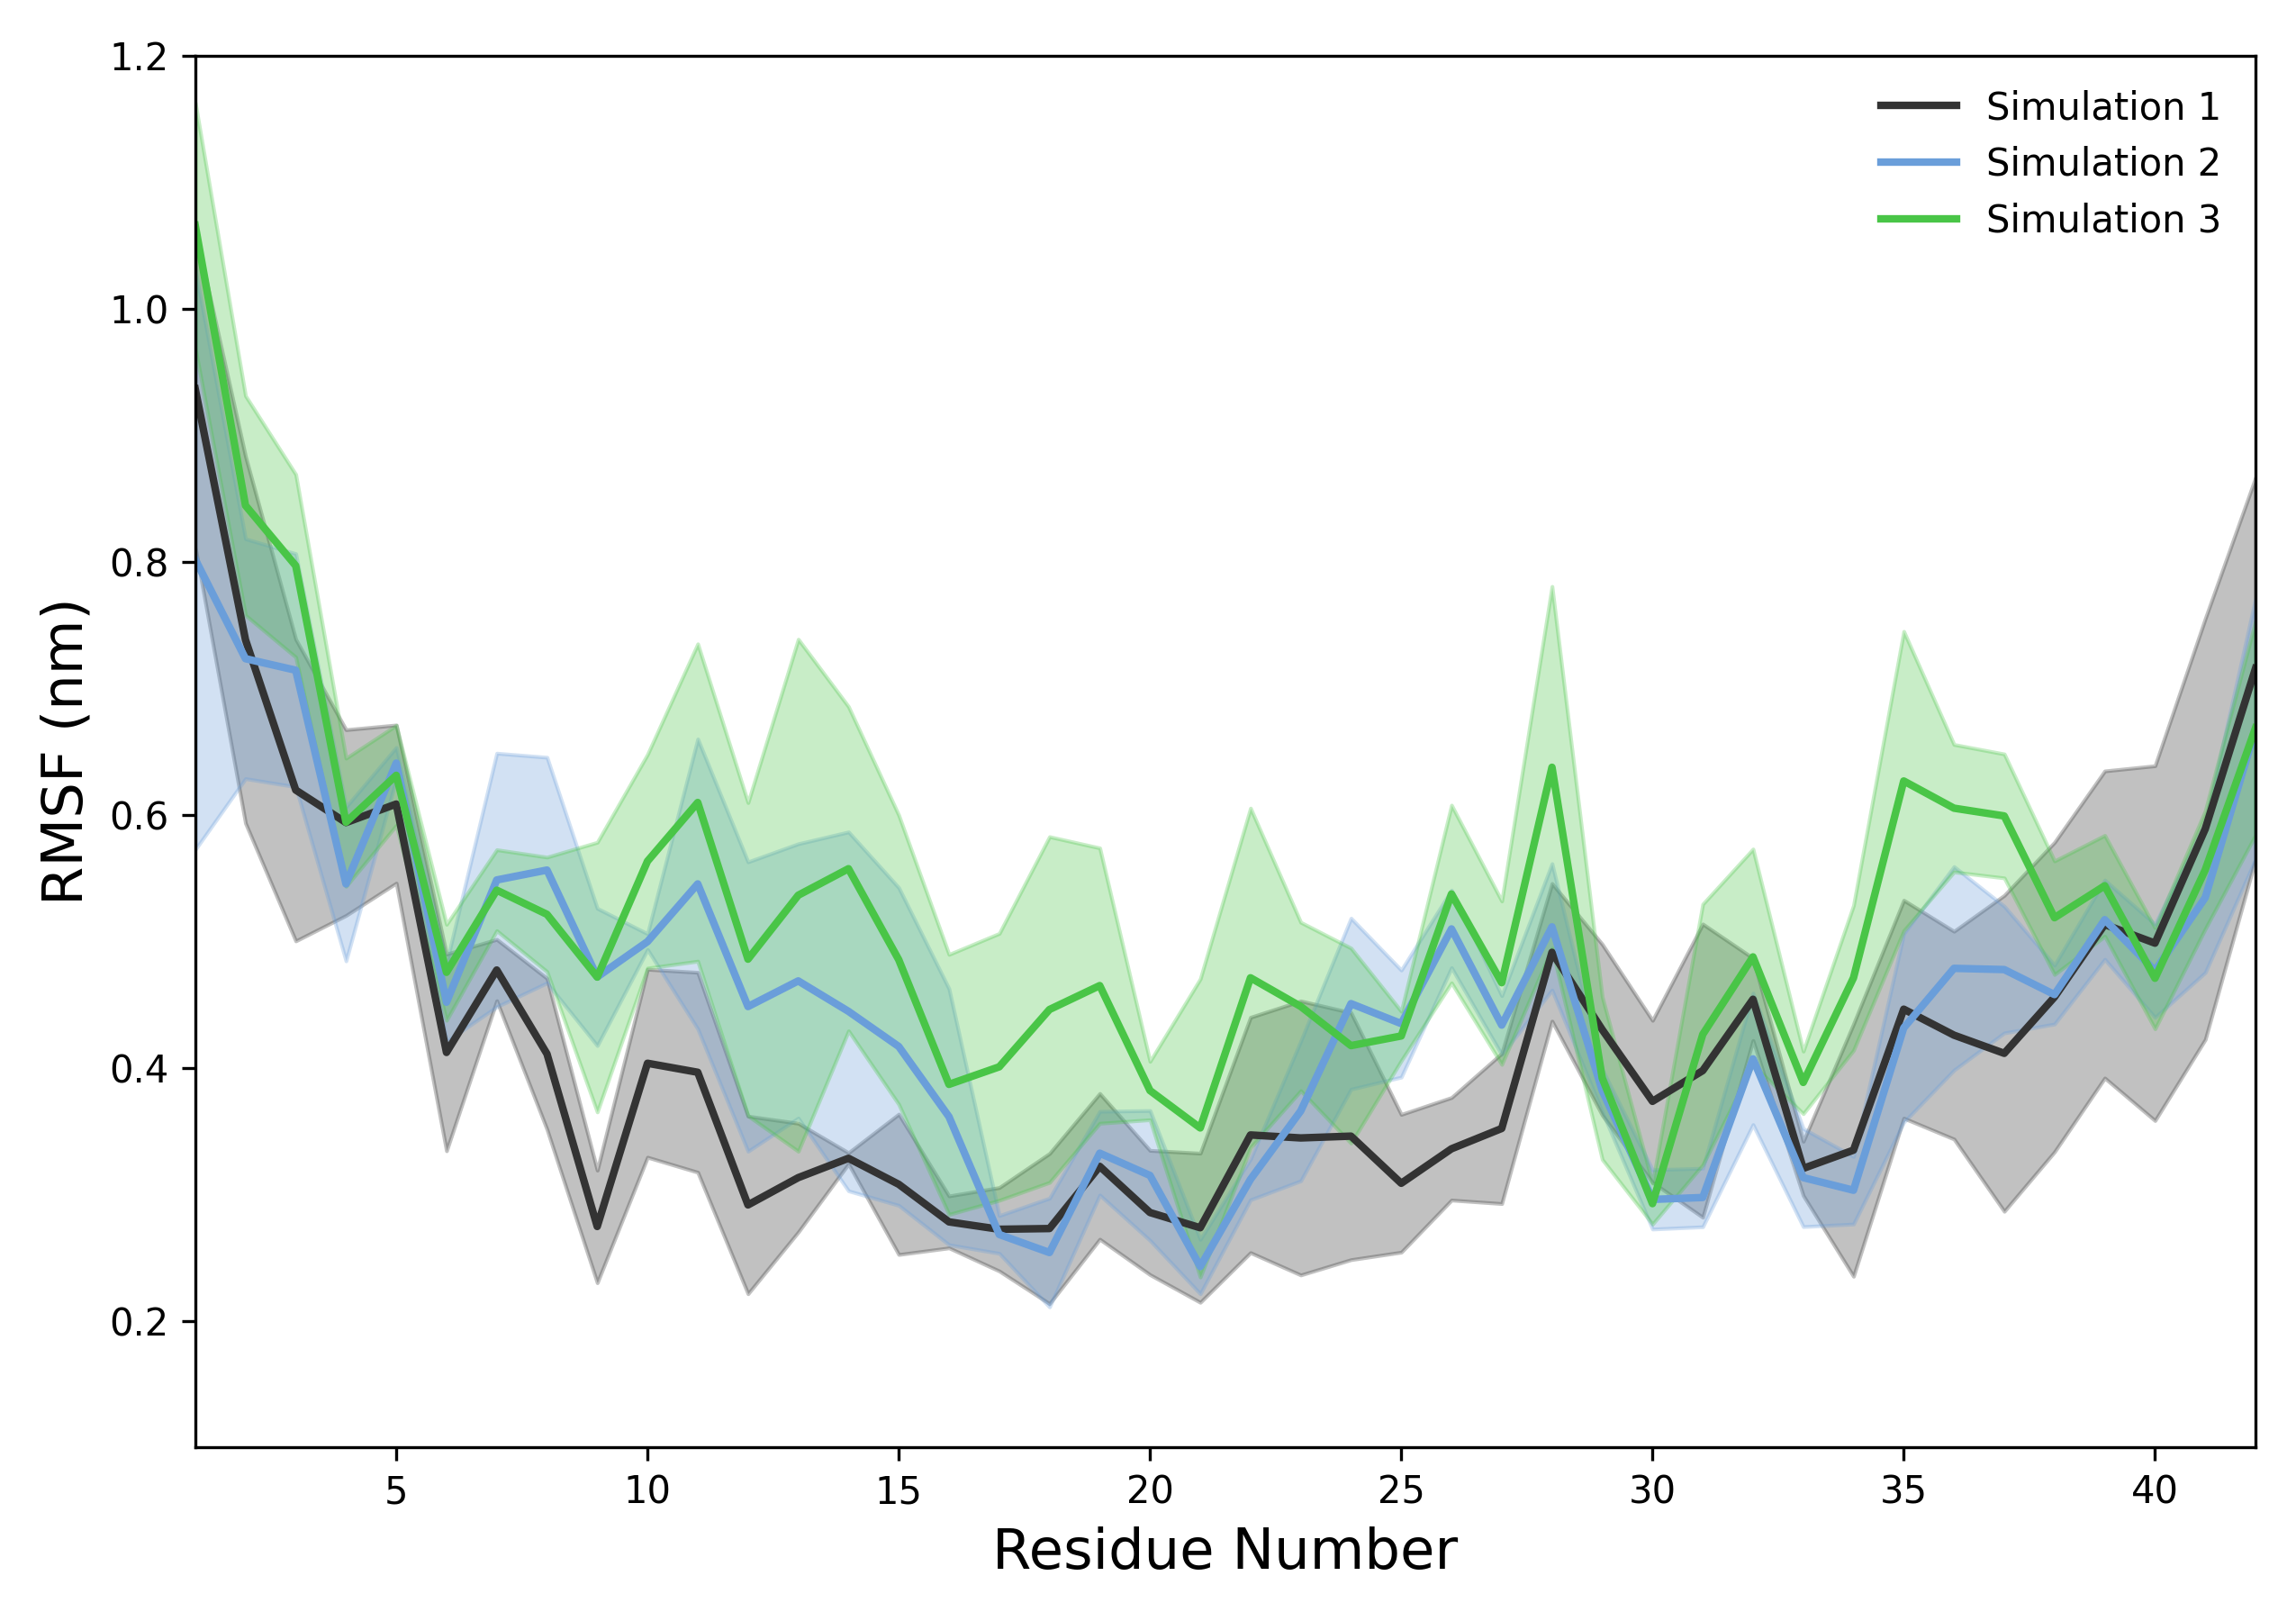
Interpretation guidence: This graph shows RMSF values across residues, where higher peaks indicate regions of greater flexibility or mobility, such as loops or termini. Lower values correspond to more rigid regions like helices or sheets. Observing these patterns helps identify functionally important flexible segments and assess the dynamic behavior of the system. Comparing RMSF profiles with references helps determine if observed fluctuations are expected or significant.
def plot_density(results, output_folder, config={})
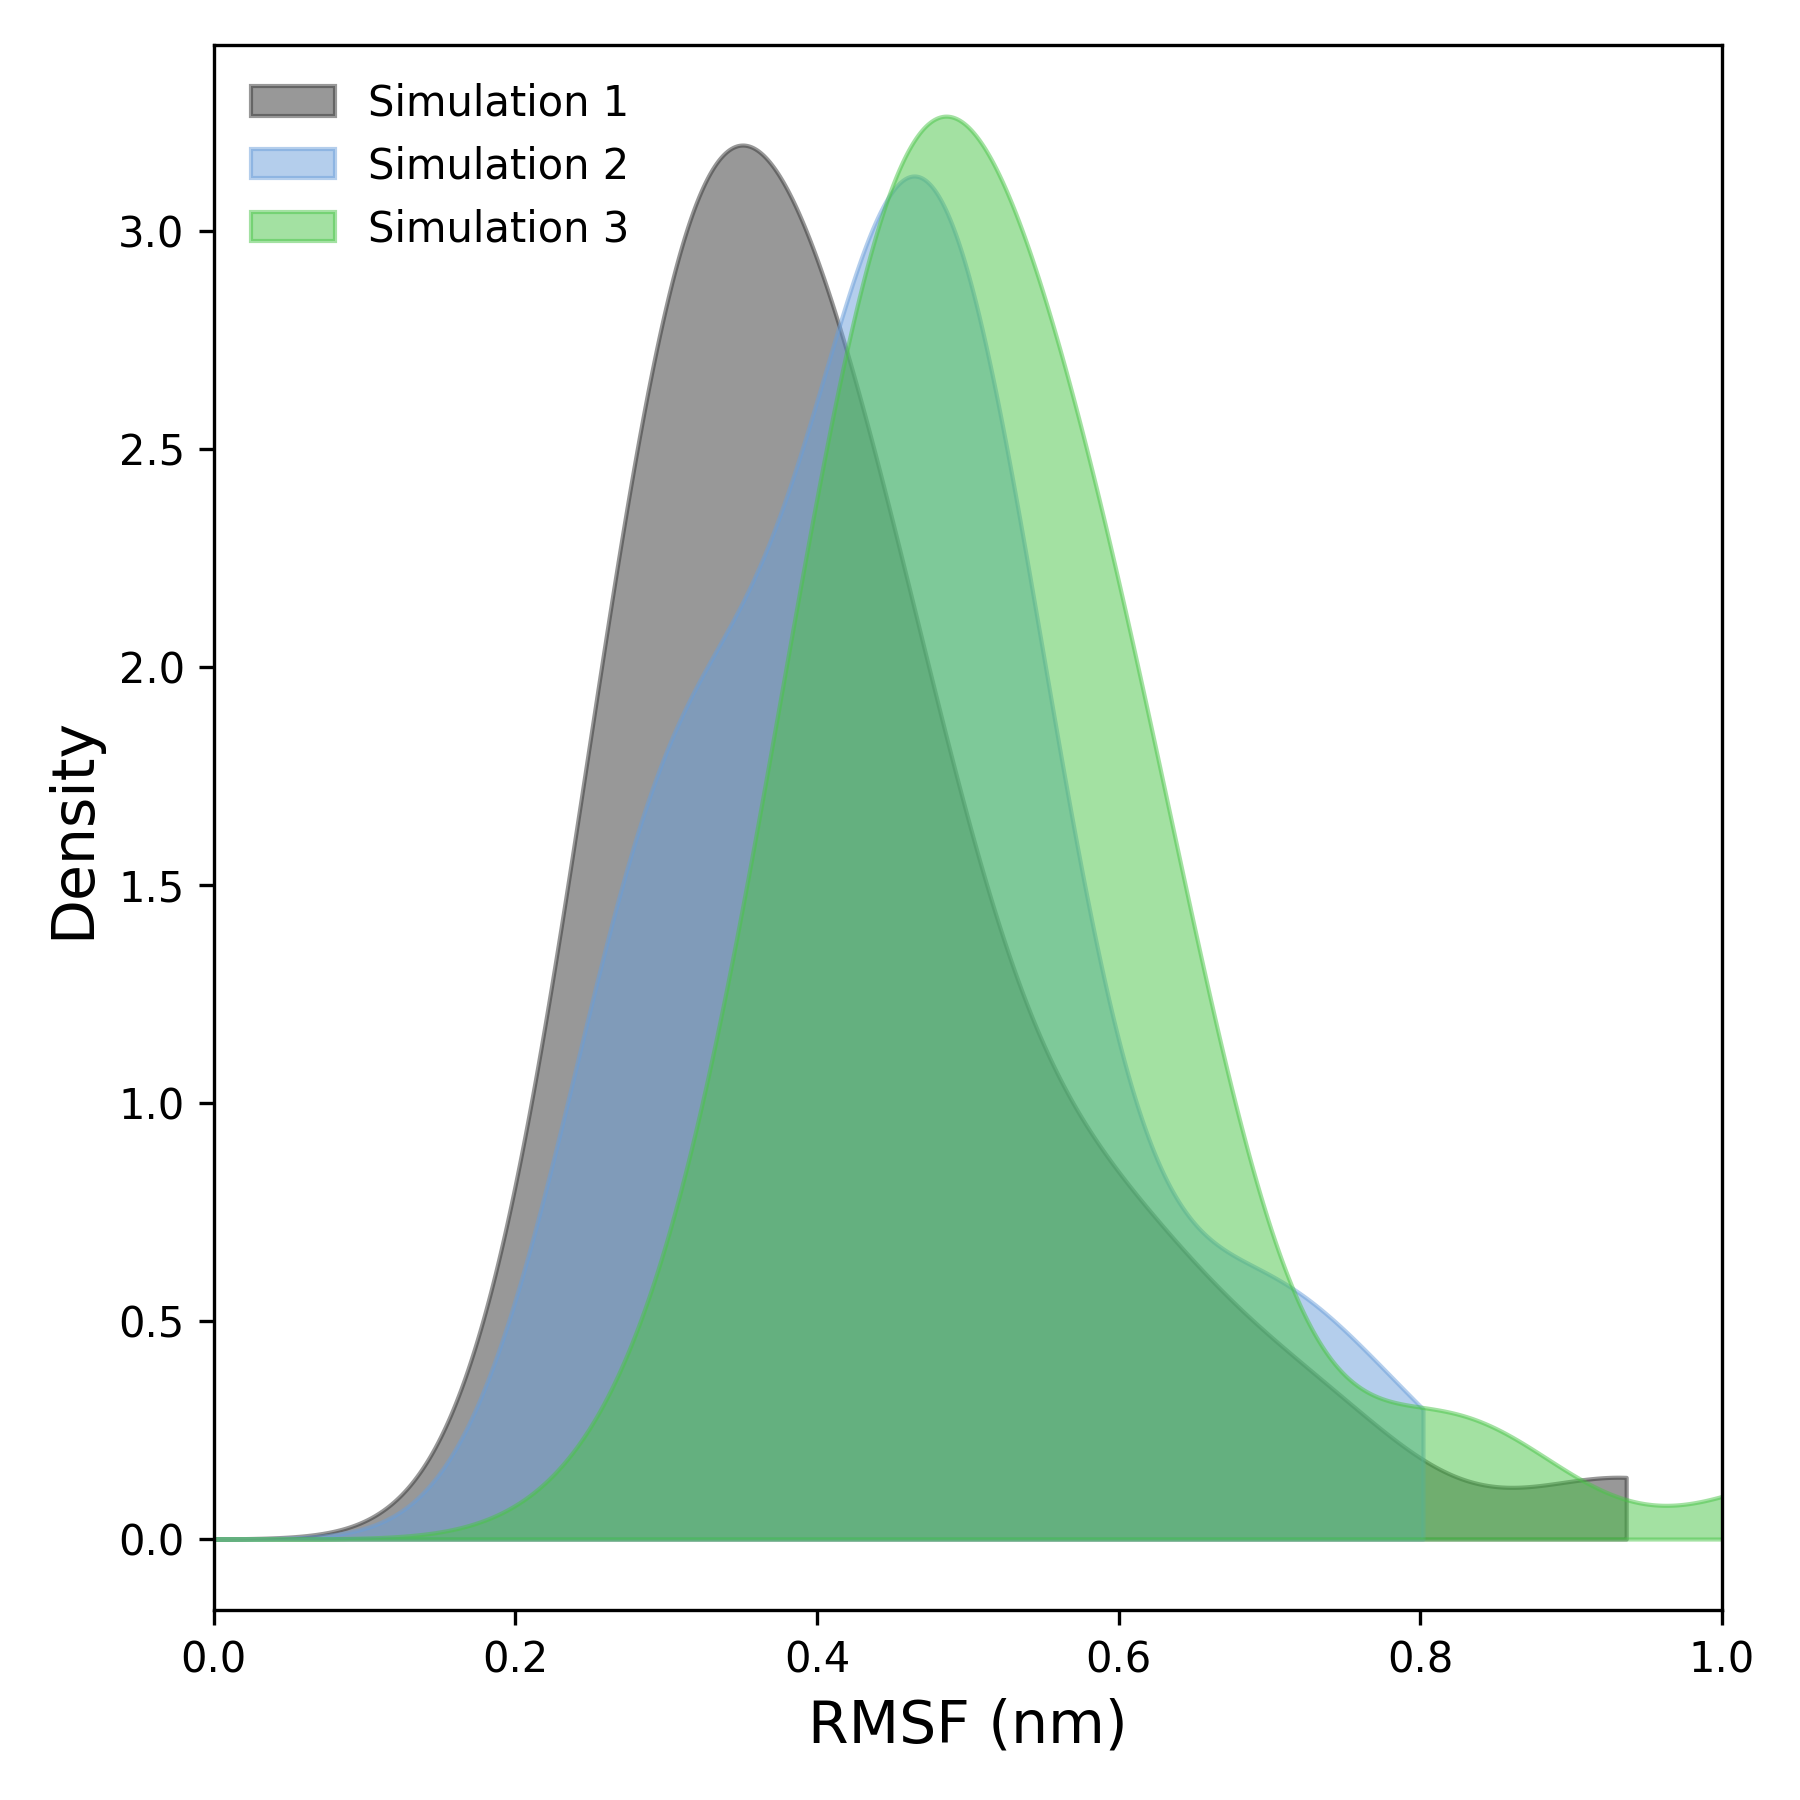
Interpretation guidence: This graph shows RMSF values across residues, where higher peaks indicate regions of greater flexibility or mobility, such as loops or termini. Lower values correspond to more rigid regions like helices or sheets. Observing these patterns helps identify functionally important flexible segments and assess the dynamic behavior of the system. Comparing RMSF profiles with references helps determine if observed fluctuations are expected or significant.
Complete code
import numpy as np
import matplotlib.pyplot as plt
from scipy.stats import gaussian_kde
import os
def read_rmsf(file):
try:
    print(f"Reading file: {file}")
    positions, rmsf_vals = [], []
    with open(file, 'r') as f:
        for line in f:
            if line.startswith(('#', '@', ';')) or line.strip() == '':
                continue
            try:
                values = line.split()
                if len(values) >= 2:
                    pos, rmsf = map(float, values[:2])
                    positions.append(pos)
                    rmsf_vals.append(rmsf)
            except ValueError:
                print(f"Error processing line: {line.strip()}")
                continue
    if len(positions) == 0 or len(rmsf_vals) == 0:
        raise ValueError(f"File {file} does not contain valid data.")
    return np.array(positions), np.array(rmsf_vals)
except Exception as e:
    print(f"Error reading file {file}: {e}")
    return None, None
def check_simulation_positions(*position_arrays):
for i in range(1, len(position_arrays)):
    if not np.allclose(position_arrays[0], position_arrays[i]):
        raise ValueError(f"Residue positions do not match between replicate 1 and replicate {i+1}")
def plot_rmsf(results, output_folder, config={}):
labels = config.get('labels', [f'Simulation {i+1}' for i in range(len(results))])
colors = config.get('colors', ['#333333', '#6A9EDA', '#54b36a', '#e67e22', '#9b59b6'])
alpha = config.get('alpha', 0.2)
figsize = config.get('figsize', (8, 6))
xlabel = config.get('xlabel', 'Residue')
ylabel = config.get('ylabel', 'RMSF (nm)')
label_fontsize = config.get('label_fontsize', 12)
xlim = config.get('xlim', None)
ylim = config.get('ylim', None)

plt.figure(figsize=figsize)

for i, (x, mean, std) in enumerate(results):
    plt.plot(x, mean, label=labels[i], color=colors[i % len(colors)], linewidth=2)
    plt.fill_between(x, mean - std, mean + std, color=colors[i % len(colors)], alpha=alpha)

plt.xlabel(xlabel, fontsize=label_fontsize)
plt.ylabel(ylabel, fontsize=label_fontsize)
plt.legend(frameon=False, loc='upper right', fontsize=10)
plt.tick_params(axis='both', which='major', labelsize=10)

if xlim:
    plt.xlim(xlim)
if ylim:
    plt.ylim(ylim)

plt.tight_layout()
os.makedirs(output_folder, exist_ok=True)
plt.savefig(os.path.join(output_folder, 'rmsf_plot.tiff'), format='tiff', dpi=300)
plt.savefig(os.path.join(output_folder, 'rmsf_plot.png'), format='png', dpi=300)
plt.show()
def plot_density(results, output_folder, config={}):
labels = config.get('labels', [f'Simulation {i+1}' for i in range(len(results))])
colors = config.get('colors', ['#333333', '#6A9EDA', '#54b36a', '#e67e22', '#9b59b6'])
alpha = config.get('alpha', 0.5)
figsize = config.get('figsize', (6, 6))
xlabel = config.get('xlabel', 'RMSF (nm)')
ylabel = config.get('ylabel', 'Density')
label_fontsize = config.get('label_fontsize', 12)
xlim = config.get('xlim', None)
ylim = config.get('ylim', None)

plt.figure(figsize=figsize)

for i, (_, mean, _) in enumerate(results):
    kde = gaussian_kde(mean)
    x = np.linspace(0, max(mean), 1000)
    plt.fill_between(x, kde(x), color=colors[i % len(colors)], alpha=alpha, label=labels[i])

plt.xlabel(xlabel, fontsize=label_fontsize)
plt.ylabel(ylabel, fontsize=label_fontsize)
plt.legend(frameon=False, loc='upper left', fontsize=10)
plt.tick_params(axis='both', which='major', labelsize=10)

if xlim:
    plt.xlim(xlim)
if ylim:
    plt.ylim(ylim)

plt.tight_layout()
os.makedirs(output_folder, exist_ok=True)
plt.savefig(os.path.join(output_folder, 'density_plot.tiff'), format='tiff', dpi=300)
plt.savefig(os.path.join(output_folder, 'density_plot.png'), format='png', dpi=300)
plt.show()
def rmsf_analysis(output_folder, *simulation_files_groups, rmsf_config=None, density_config=None):
if rmsf_config is None:
    rmsf_config = {}
if density_config is None:
    density_config = {}

def process_group(file_paths):
    positions = []
    values = []
    for file in file_paths:
        pos, rmsf = read_rmsf(file)
        if pos is None or rmsf is None:
            raise ValueError(f"Error reading file: {file}")
        positions.append(pos)
        values.append(rmsf)
    check_simulation_positions(*positions)
    return positions[0], np.mean(values, axis=0), np.std(values, axis=0)

results = []
for group in simulation_files_groups:
    if group:
        result = process_group(group)
        results.append(result)

if not results:
    raise ValueError("At least one group of simulation files is required.")

plot_rmsf(results, output_folder, rmsf_config)
plot_density(results, output_folder, density_config)