Salt Bridge
Overview
DynamiSpectra offers a robust salt bridge analysis tool for molecular dynamics simulations. This module tracks the minimum distances between charged groups in the protein and ligand over time, using input data in standardized .xvg file format. It supports analysis of individual replicas as well as averaging across multiple replicas, providing mean distances and variability (standard deviation). The generated plots visualize the temporal evolution of these distances, with shaded regions indicating the variability, facilitating clear interpretation of salt bridge stability.
Command line in GROMACS to generate .xvg files for the analysis:
gmx mindist -f Simulation.xtc -s Simulation.tpr -n index.ndx -od Simulation.xvg -on saltbridge_csimulation.xvg -group -d 0.4
def saltbridge_analysis(output_folder, *simulation_files_groups, saltbridge_config=None, density_config=None)
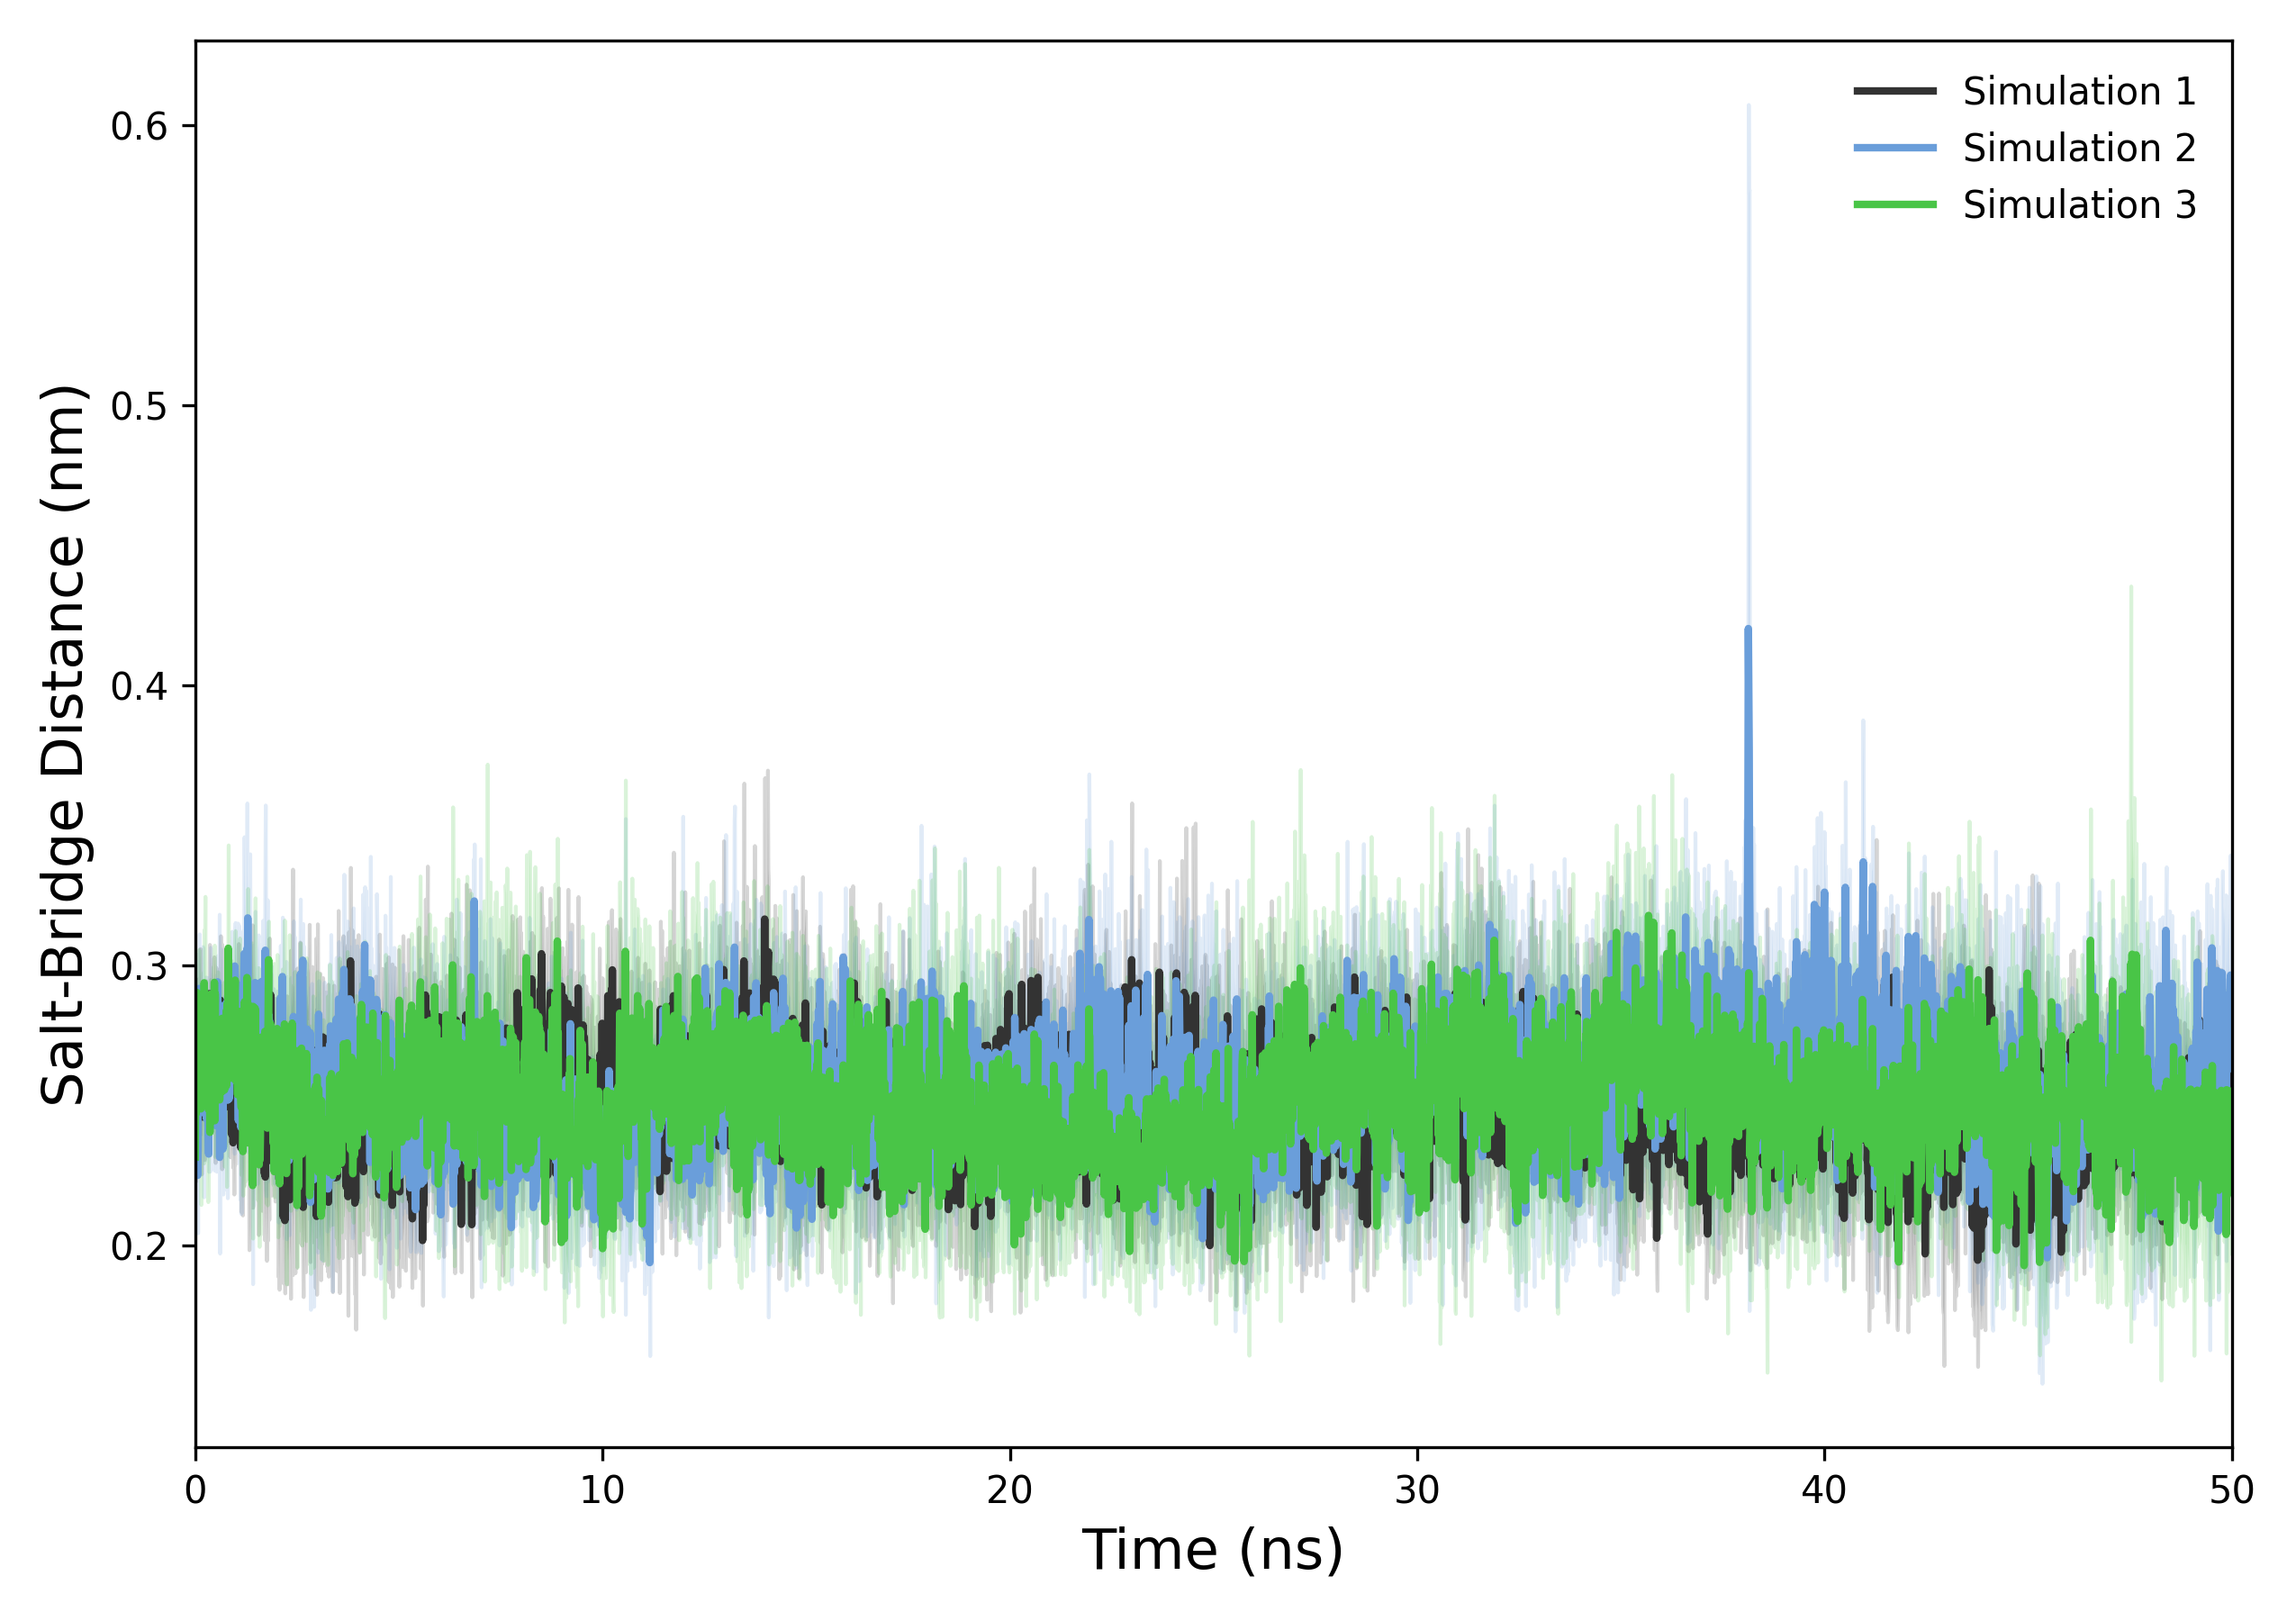
Interpretation guidance: This graph shows the evolution of the minimum distance between charged groups of the ligand and the protein over time, based on data from .xvg files. When analyzing it, observe if the distance stabilizes below a threshold indicating the presence of a stable salt bridge interaction. Small fluctuations around a consistent low distance suggest a persistent salt bridge, while large increases or irregular spikes may indicate the breaking or absence of the interaction. Comparing distance values with known thresholds or reference data helps determine the significance of the salt bridge throughout the simulation.
def plot_density(results, output_folder, config)
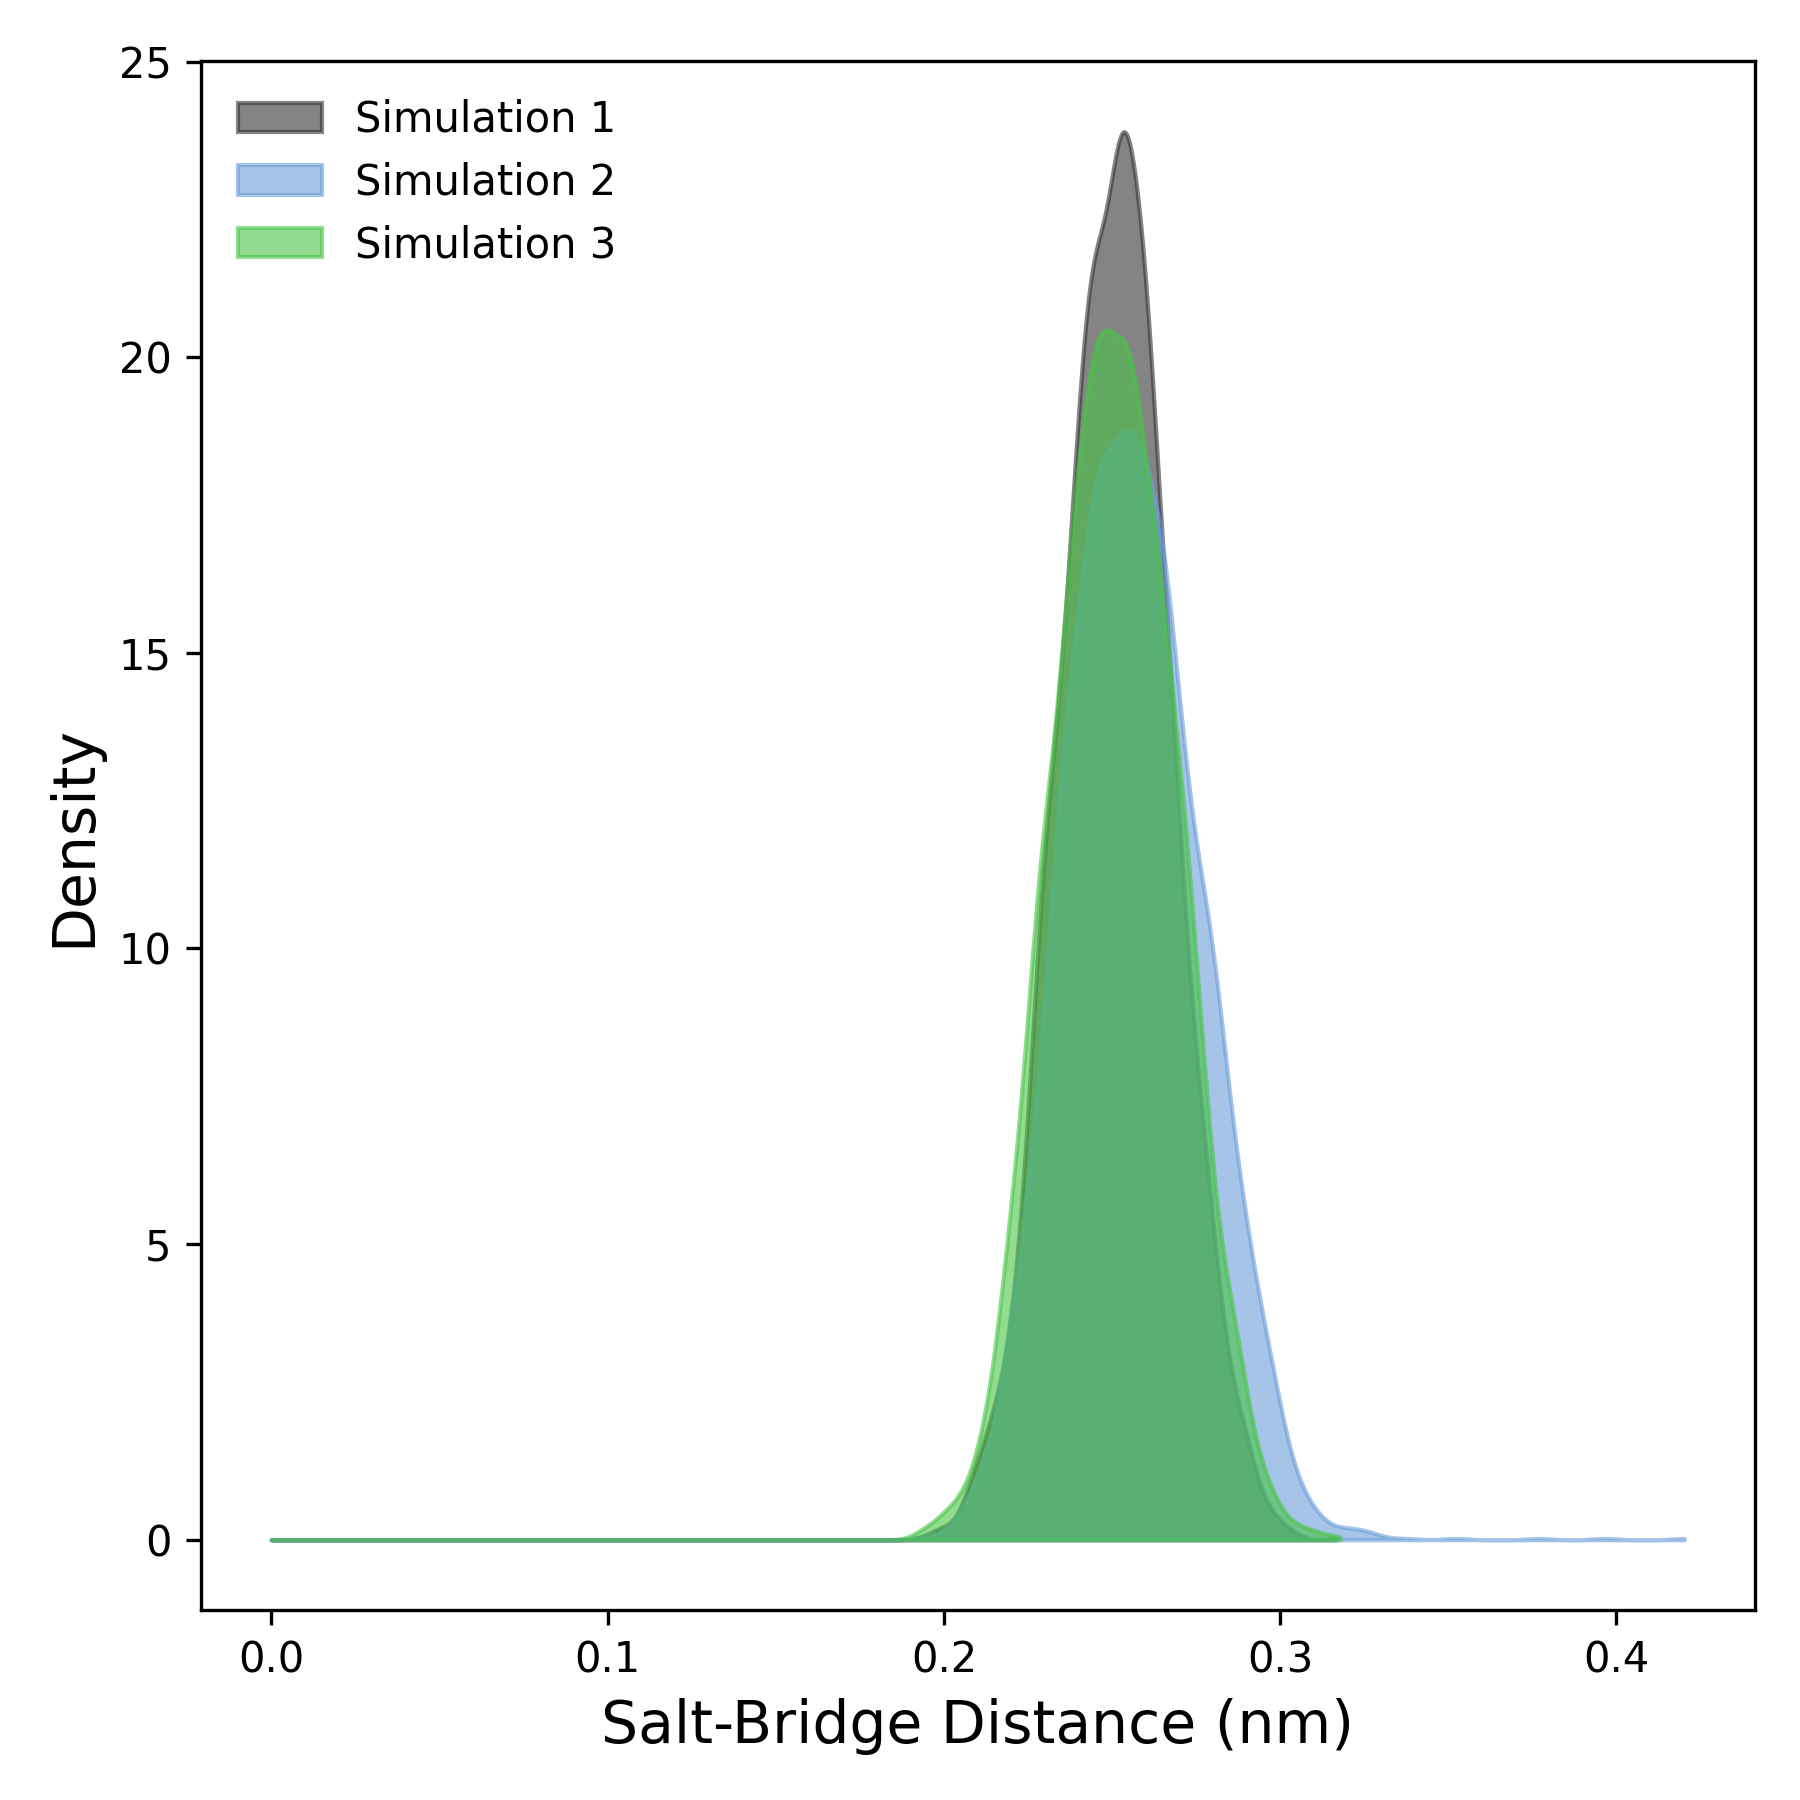
Interpretation guidance: This plot shows the distribution of salt bridge distances during the simulation. Peaks at lower distances indicate stable interactions, while broader or shifted peaks suggest more variability or disruption. Comparing curves reveals differences in salt bridge persistence across simulations.
Complete code
import numpy as np
import matplotlib.pyplot as plt
from scipy.stats import gaussian_kde
import os
def read_saltbridge(file):
try:
    print(f"Reading file: {file}")
    times, distances = [], []
    with open(file, 'r') as f:
        for line in f:
            if line.startswith(('#', '@', ';')) or line.strip() == '':
                continue
            try:
                values = line.split()
                if len(values) >= 2:
                    time, distance = map(float, values[:2])
                    times.append(time / 1000.0)  # Convert ps to ns
                    distances.append(distance)
            except ValueError:
                print(f"Error processing line: {line.strip()}")
                continue
    if len(times) == 0 or len(distances) == 0:
        raise ValueError(f"File {file} does not contain valid data.")
    return np.array(times), np.array(distances)
except Exception as e:
    print(f"Error reading file {file}: {e}")
    return None, None
def check_simulation_times(*time_arrays):
for i in range(1, len(time_arrays)):
    if not np.allclose(time_arrays[0], time_arrays[i]):
        raise ValueError(f"Simulation times do not match between file 1 and file {i+1}")
def plot_saltbridge(results, output_folder, config):
labels = config.get('labels', [f'Simulation {i+1}' for i in range(len(results))])
colors = config.get('colors', ['#333333', '#6A9EDA', '#54b36a', '#f39c12', '#8e44ad'])
alpha = config.get('alpha', 0.2)
figsize = config.get('figsize', (7, 6))
xlabel = config.get('xlabel', 'Time (ns)')
ylabel = config.get('ylabel', 'Salt-Bridge Distance (nm)')
label_fontsize = config.get('label_fontsize', 12)
xlim = config.get('xlim', None)
ylim = config.get('ylim', None)

plt.figure(figsize=figsize)

for i, (time, mean, std) in enumerate(results):
    plt.plot(time, mean, label=labels[i], color=colors[i % len(colors)], linewidth=2)
    plt.fill_between(time, mean - std, mean + std, color=colors[i % len(colors)], alpha=alpha)

plt.xlabel(xlabel, fontsize=label_fontsize)
plt.ylabel(ylabel, fontsize=label_fontsize)
plt.legend(frameon=False, loc='upper right', fontsize=10)
plt.tick_params(axis='both', which='major', labelsize=10)

if xlim:
    plt.xlim(xlim)
else:
    max_time = max([t[-1] for t, _, _ in results])
    plt.xlim(0, max_time)

if ylim:
    plt.ylim(ylim)

plt.tight_layout()
os.makedirs(output_folder, exist_ok=True)
plt.savefig(os.path.join(output_folder, 'saltbridge_plot.tiff'), format='tiff', dpi=300)
plt.savefig(os.path.join(output_folder, 'saltbridge_plot.png'), format='png', dpi=300)
plt.show()
def plot_density(results, output_folder, config):
labels = config.get('labels', [f'Simulation {i+1}' for i in range(len(results))])
colors = config.get('colors', ['#333333', '#6A9EDA', '#54b36a', '#f39c12', '#8e44ad'])
alpha = config.get('alpha', 0.5)
figsize = config.get('figsize', (6, 6))
xlabel = config.get('xlabel', 'Salt-Bridge Distance (nm)')
ylabel = config.get('ylabel', 'Density')
label_fontsize = config.get('label_fontsize', 12)
xlim = config.get('xlim', None)
ylim = config.get('ylim', None)

plt.figure(figsize=figsize)

for i, (_, mean, _) in enumerate(results):
    kde = gaussian_kde(mean)
    x = np.linspace(0, max(mean), 1000)
    plt.fill_between(x, kde(x), color=colors[i % len(colors)], alpha=alpha, label=labels[i])

plt.xlabel(xlabel, fontsize=label_fontsize)
plt.ylabel(ylabel, fontsize=label_fontsize)
plt.legend(frameon=False, loc='upper left', fontsize=10)
plt.tick_params(axis='both', which='major', labelsize=10)

if xlim:
    plt.xlim(xlim)
if ylim:
    plt.ylim(ylim)

plt.tight_layout()
os.makedirs(output_folder, exist_ok=True)
plt.savefig(os.path.join(output_folder, 'saltbridge_density.tiff'), format='tiff', dpi=300)
plt.savefig(os.path.join(output_folder, 'saltbridge_density.png'), format='png', dpi=300)
plt.show()
def saltbridge_analysis(output_folder, *simulation_files_groups, saltbridge_config=None, density_config=None):
if saltbridge_config is None:
    saltbridge_config = {}
if density_config is None:
    density_config = {}

def process_group(file_paths):
    times, distances = [], []
    for file in file_paths:
        time, dist = read_saltbridge(file)
        if time is None or dist is None:
            raise ValueError(f"Error reading file: {file}")
        times.append(time)
        distances.append(dist)
    check_simulation_times(*times)
    return times[0], np.mean(distances, axis=0), np.std(distances, axis=0)

results = []
for group in simulation_files_groups:
    if group:
        time, mean, std = process_group(group)
        results.append((time, mean, std))

if not results:
    raise ValueError("You must provide at least one group of simulation files.")

plot_saltbridge(results, output_folder, saltbridge_config)
plot_density(results, output_folder, density_config)