RMSD
Overview
DynamiSpectra enables comprehensive analysis of Root Mean Square Deviation (RMSD) from molecular dynamics simulations using .xvg files. The tool supports the processing of multiple replicates per simulation group, allowing the calculation of average and standard deviation to capture structural deviations over time. However, it can also be applied to a single replicate, making it suitable for both exploratory analyses and more robust comparative studies involving multiple trajectories.
The generated plots provide time series visualizations with shaded standard deviations and kernel density distributions of RMSD values. This allows users to assess the dynamic stability of systems across simulations and compare structural drift between conditions.
Command line in GROMACS to generate .xvg files for the analysis:
gmx rms -s Simulation.tpr -f Simulation.xtc -n index.ndx -tu ns -o Simulation.xvg
def rmsd_analysis(output_folder, *simulation_file_groups, rmsd_config=None, density_config=None)
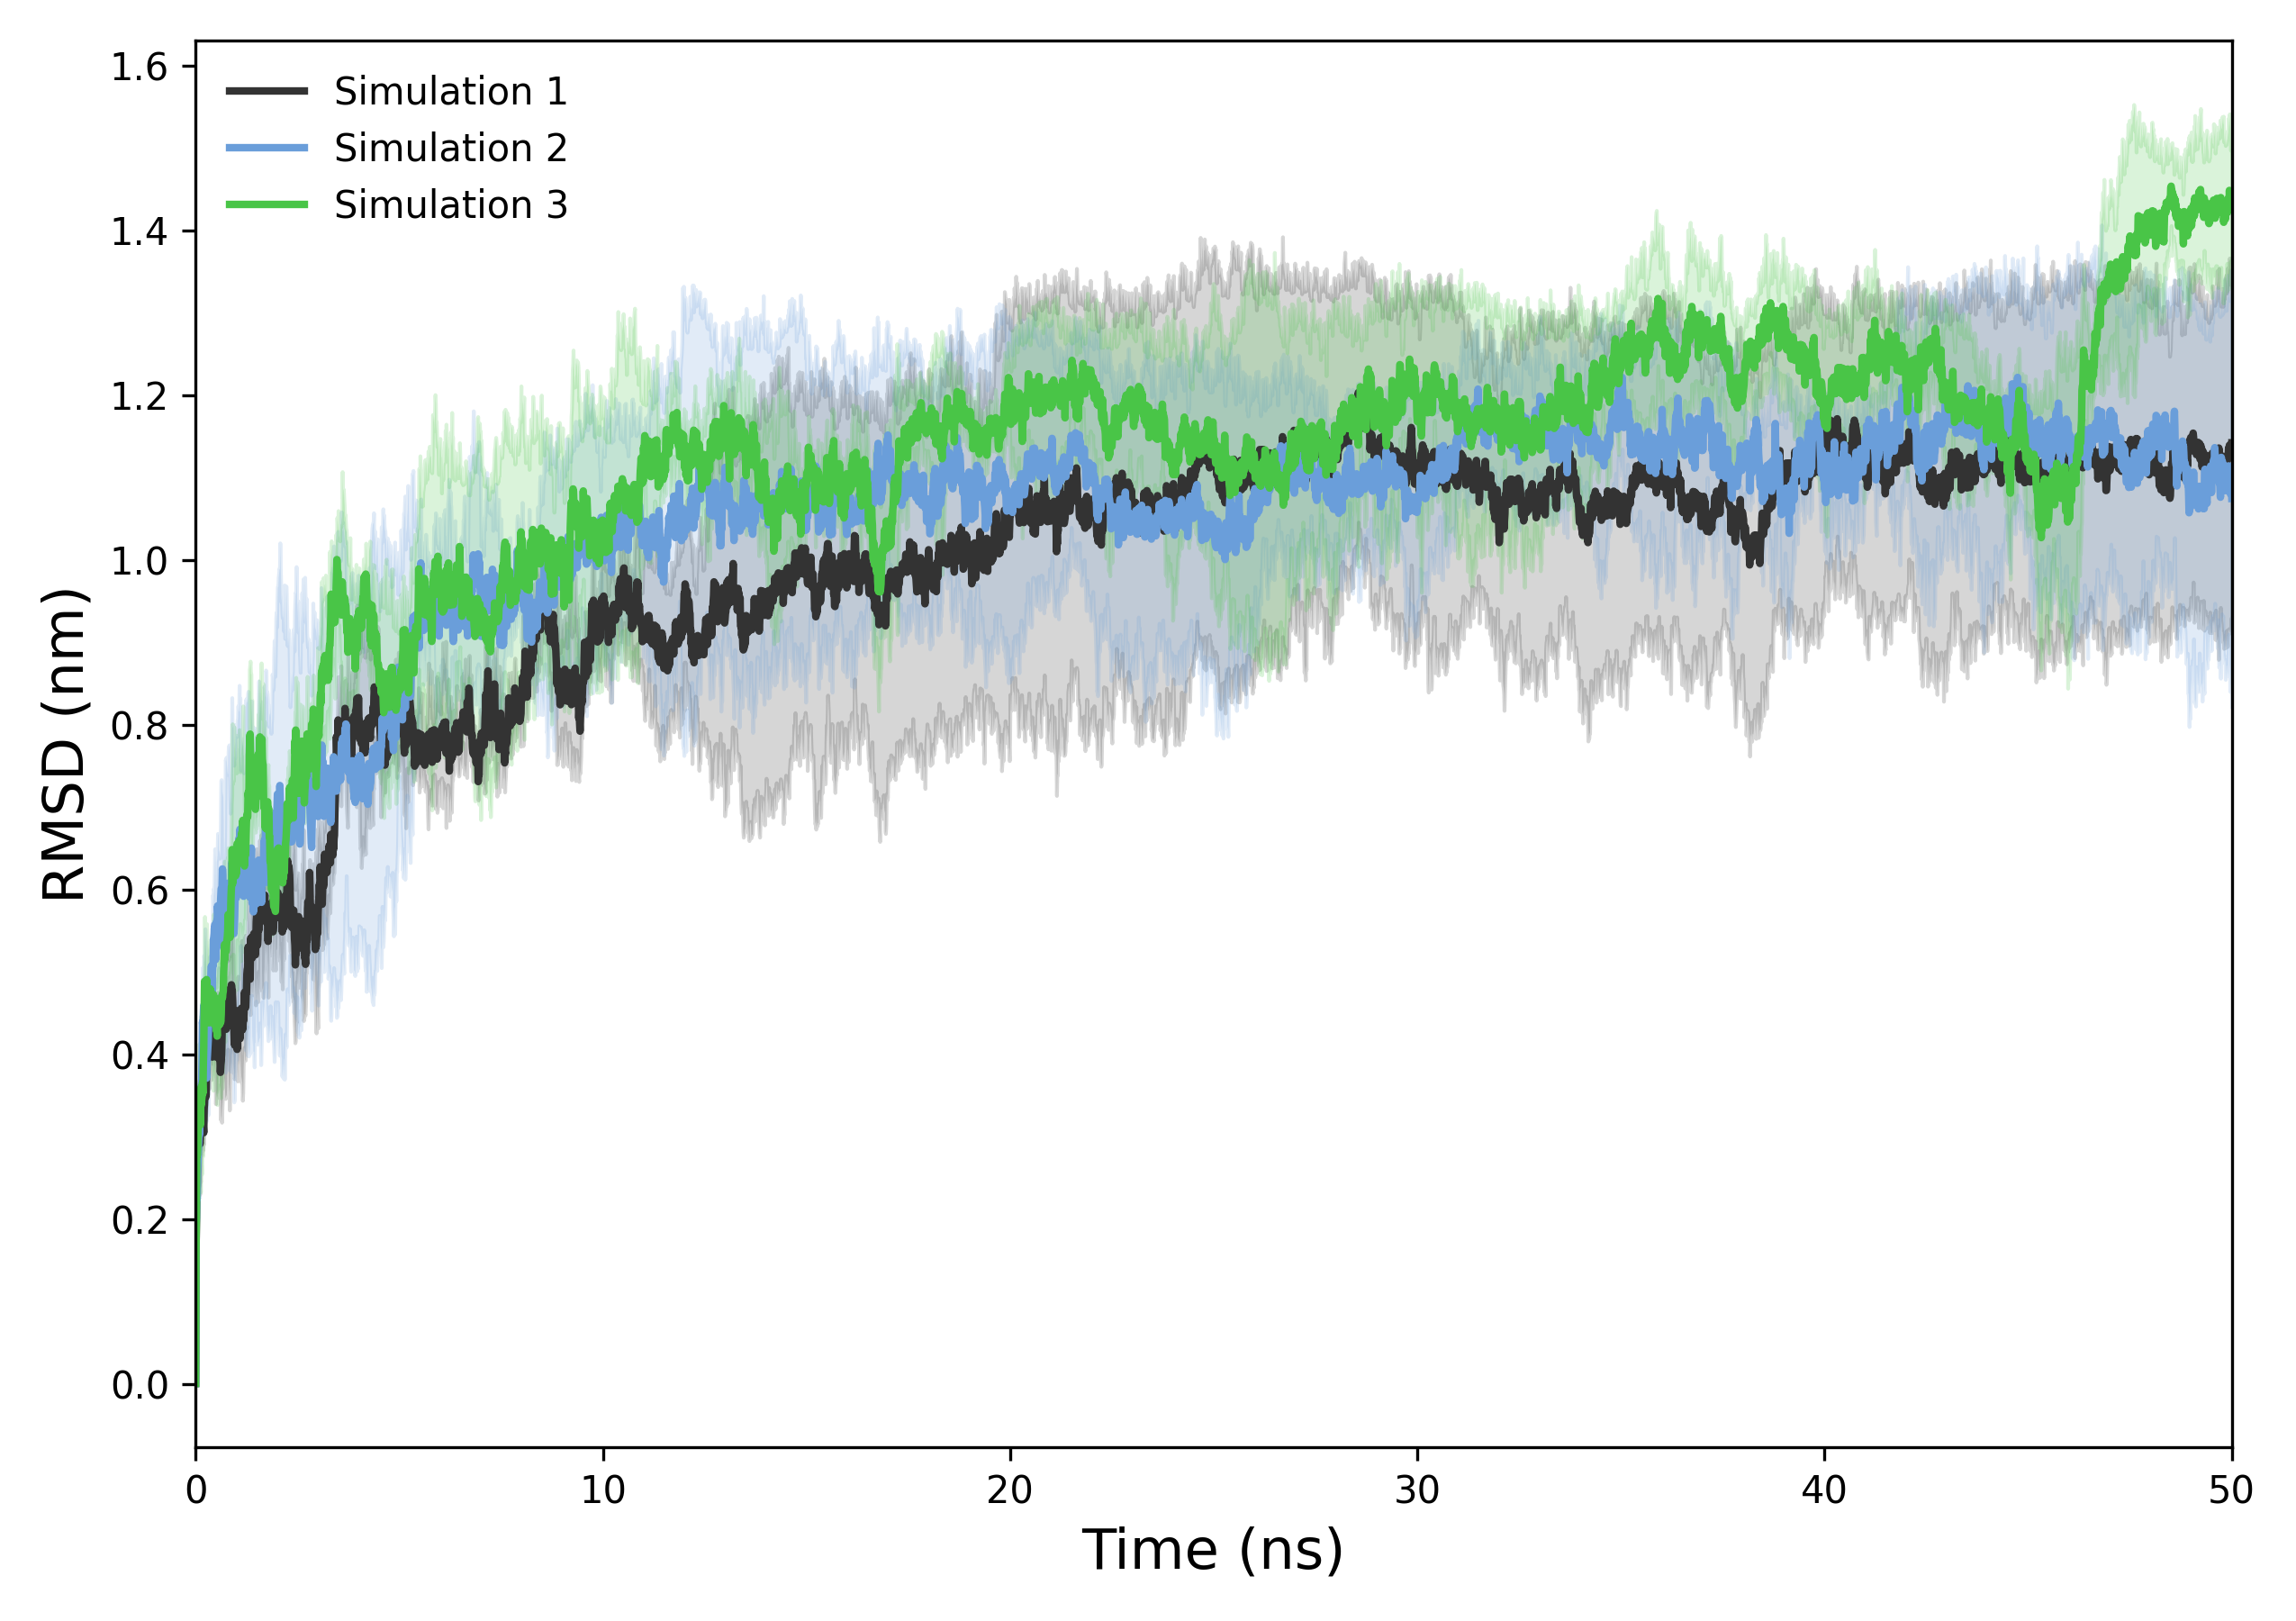
Interpretation guidence: This plot illustrates the temporal evolution of structural deviation relative to the reference conformation during the simulation. A stable RMSD plateau indicates that the system has equilibrated and maintains a consistent structure. Gradual increases or large fluctuations suggest ongoing conformational changes, instability, or unfolding events. Assessing the RMSD trend helps identify when the system reaches equilibrium and whether structural deviations remain within expected biological variability.
def plot_density_all(results, output_folder, config)
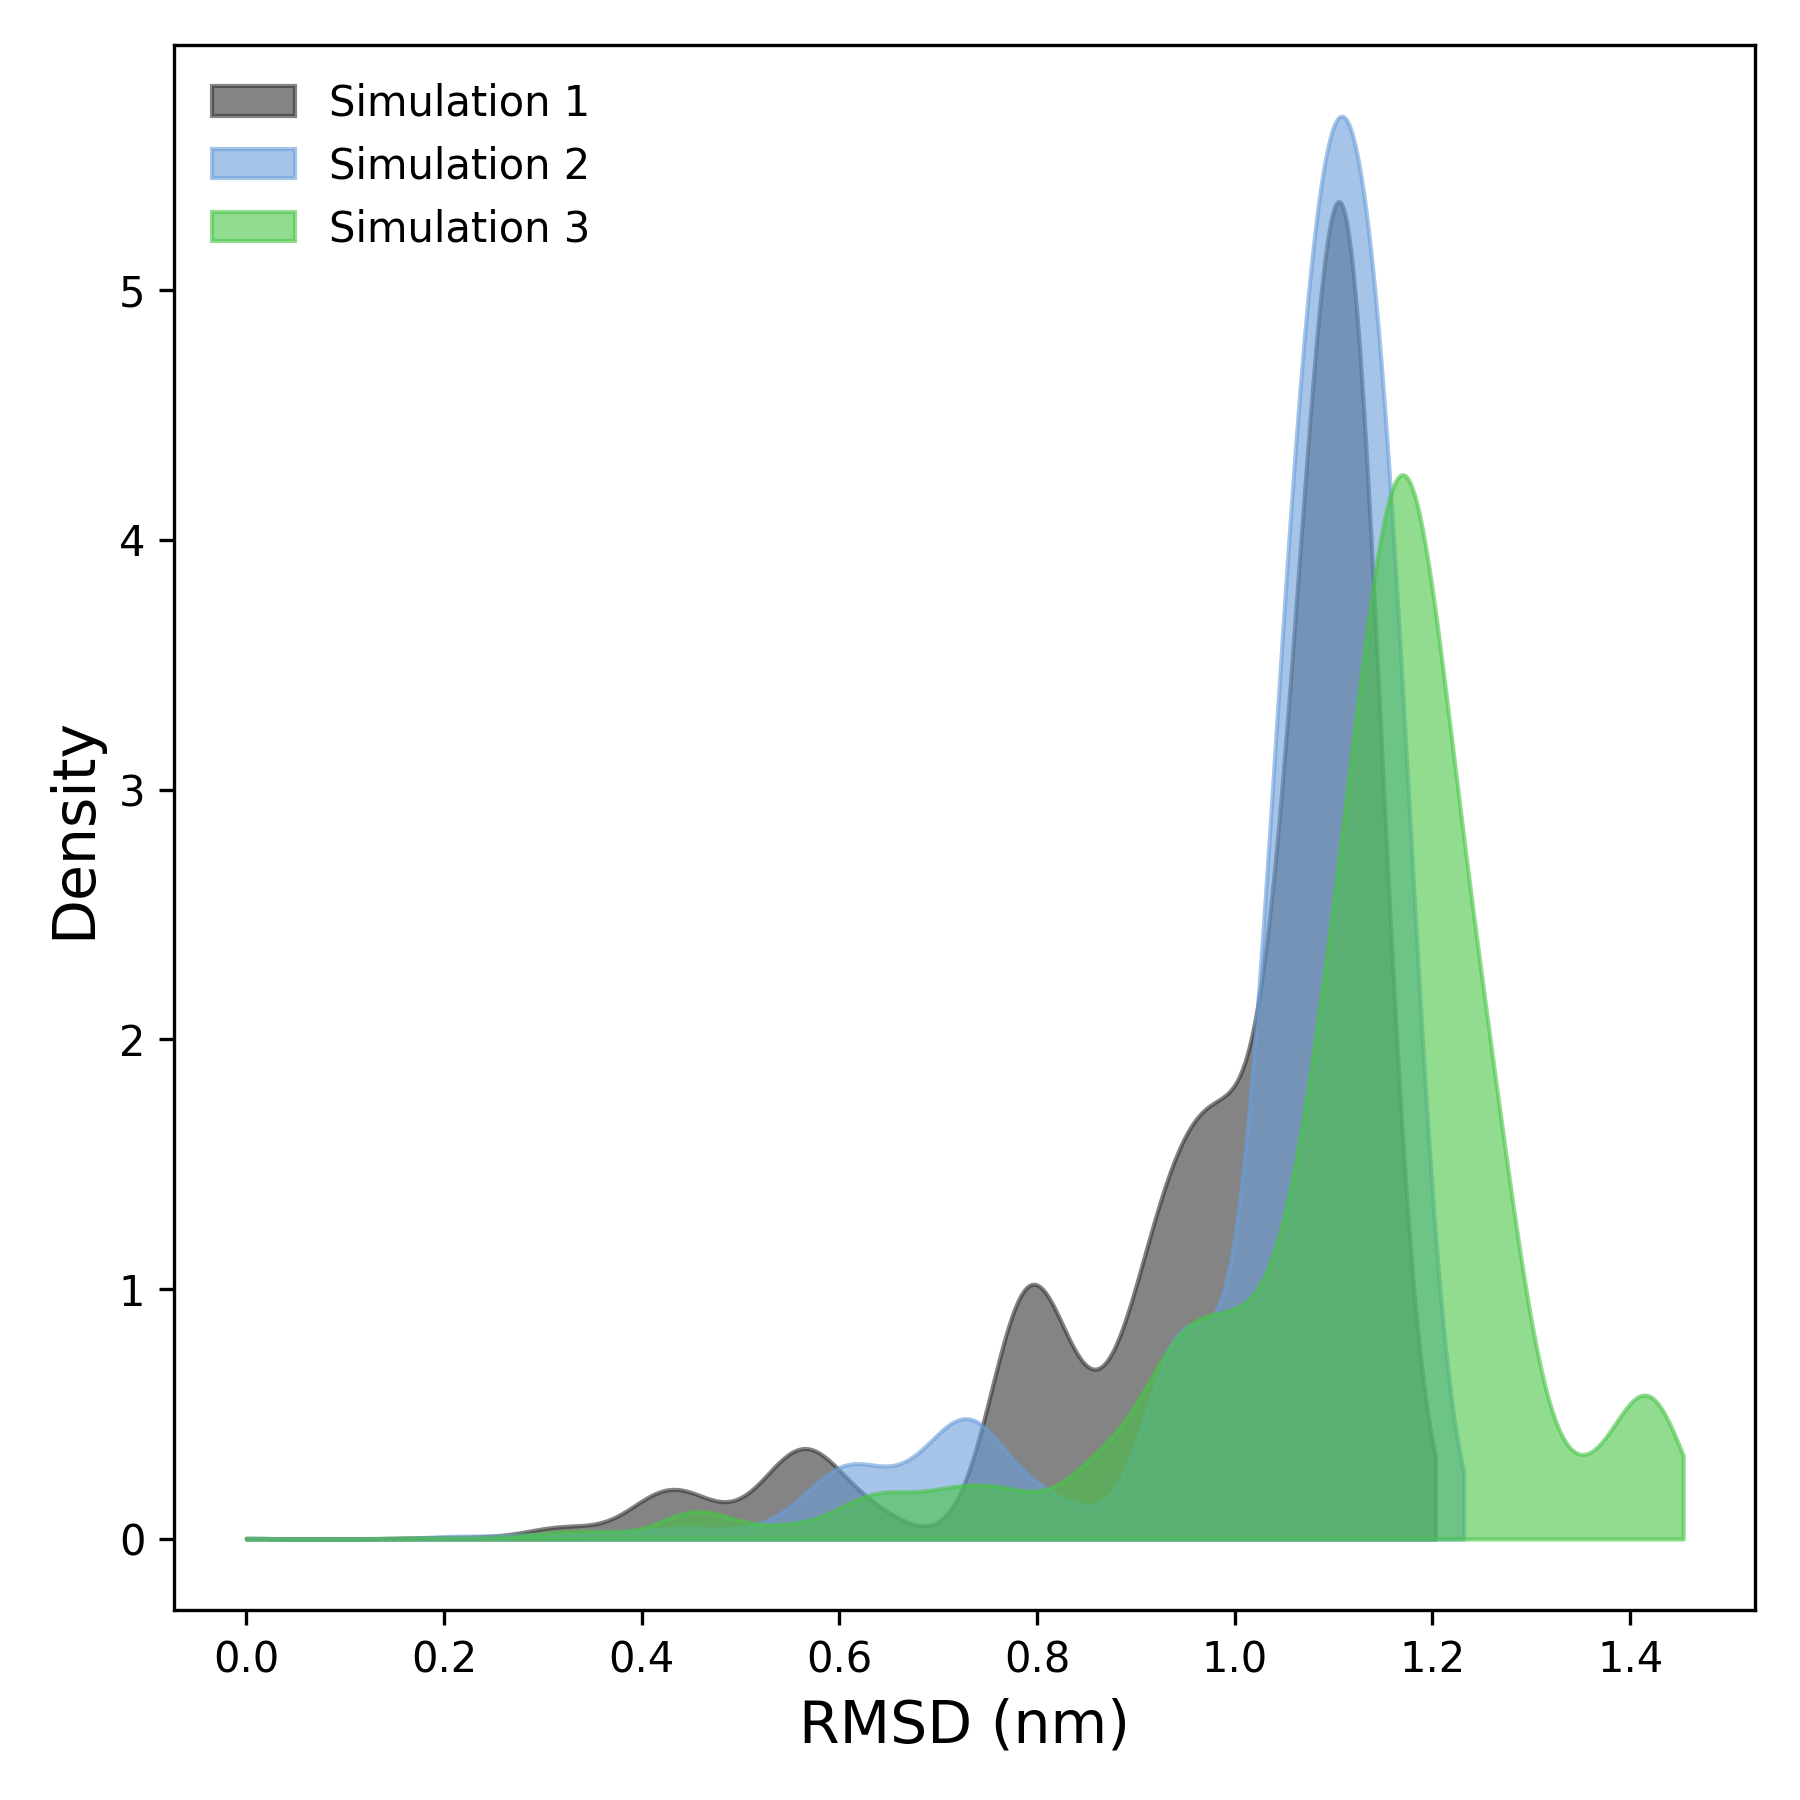
Interpretation guidence: This plot shows how frequently different RMSD values occur during the simulation. Sharp peaks indicate stable conformations, while broader or multiple peaks reveal structural flexibility or transitions between states.
Complete code
import numpy as np
import matplotlib.pyplot as plt
from scipy.stats import gaussian_kde
import os
def read_rmsd(file):
"""
Reads RMSD data from a .xvg file.
Skips header/comment lines and extracts time and RMSD values.
"""
try:
    print(f"Reading file: {file}")
    times, rmsd = [], []
    with open(file, 'r') as f:
        for line in f:
            if line.startswith(('#', '@', ';')) or line.strip() == '':
                continue
            try:
                values = line.split()
                if len(values) >= 2:
                    time, rmsd_val = map(float, values[:2])
                    times.append(time)
                    rmsd.append(rmsd_val)
            except ValueError:
                print(f"Error processing line: {line.strip()}")
                continue
    if len(times) == 0 or len(rmsd) == 0:
        raise ValueError(f"File {file} does not contain valid data.")
    return np.array(times), np.array(rmsd)
except Exception as e:
    print(f"Error reading file {file}: {e}")
    return None, None
def check_simulation_times(*time_arrays):
"""
Ensure all replicate time arrays in a group are aligned.
"""
for i in range(1, len(time_arrays)):
    if not np.allclose(time_arrays[0], time_arrays[i]):
        raise ValueError(f"Simulation times do not match between replicate 1 and replicate {i+1}")
def plot_rmsd_all(results, output_folder, config):
"""
Plot RMSD time series with mean ± std for all simulation groups.
"""
labels = config.get('labels', [f'Simulation {i+1}' for i in range(len(results))])
colors = config.get('colors', None)
alpha = config.get('alpha', 0.2)
figsize = config.get('figsize', (8, 6))
xlabel = config.get('xlabel', 'Time (ps)')
ylabel = config.get('ylabel', 'RMSD (nm)')
label_fontsize = config.get('label_fontsize', 12)
xlim = config.get('xlim', None)
ylim = config.get('ylim', None)

plt.figure(figsize=figsize)

for i, (time, mean, std) in enumerate(results):
    color = colors[i] if colors and i < len(colors) else None
    plt.plot(time, mean, label=labels[i], color=color, linewidth=2)
    plt.fill_between(time, mean - std, mean + std, color=color, alpha=alpha)

plt.xlabel(xlabel, fontsize=label_fontsize)
plt.ylabel(ylabel, fontsize=label_fontsize)
plt.legend(frameon=False, loc='best', fontsize=10)
plt.tick_params(axis='both', which='major', labelsize=10)

if xlim:
    plt.xlim(xlim)
else:
    max_time = max([np.max(time) for time, _, _ in results])
    plt.xlim(0, max_time)

if ylim:
    plt.ylim(ylim)

plt.tight_layout()
os.makedirs(output_folder, exist_ok=True)
plt.savefig(os.path.join(output_folder, 'rmsd_plot.tiff'), dpi=300)
plt.savefig(os.path.join(output_folder, 'rmsd_plot.png'), dpi=300)
plt.show()
def plot_density_all(results, output_folder, config):
"""
Plot KDE density of RMSD values for all simulation groups.
"""
labels = config.get('labels', [f'Simulation {i+1}' for i in range(len(results))])
colors = config.get('colors', None)
alpha = config.get('alpha', 0.5)
figsize = config.get('figsize', (6, 6))
xlabel = config.get('xlabel', 'RMSD (nm)')
ylabel = config.get('ylabel', 'Density')
label_fontsize = config.get('label_fontsize', 12)
xlim = config.get('xlim', None)
ylim = config.get('ylim', None)

plt.figure(figsize=figsize)

for i, (_, mean, _) in enumerate(results):
    color = colors[i] if colors and i < len(colors) else None
    kde = gaussian_kde(mean)
    x_min = 0
    x_max = max(mean) if max(mean) > 0 else 1
    x_vals = np.linspace(x_min, x_max, 1000)
    plt.fill_between(x_vals, kde(x_vals), color=color, alpha=alpha, label=labels[i])

plt.xlabel(xlabel, fontsize=label_fontsize)
plt.ylabel(ylabel, fontsize=label_fontsize)
plt.legend(frameon=False, loc='best', fontsize=10)
plt.tick_params(axis='both', which='major', labelsize=10)

if xlim:
    plt.xlim(xlim)
if ylim:
    plt.ylim(ylim)

plt.tight_layout()
os.makedirs(output_folder, exist_ok=True)
plt.savefig(os.path.join(output_folder, 'density_plot.tiff'), dpi=300)
plt.savefig(os.path.join(output_folder, 'density_plot.png'), dpi=300)
plt.show()
def rmsd_analysis(output_folder, *simulation_file_groups, rmsd_config=None, density_config=None):
"""
Main function to process multiple simulation groups, each with multiple replicate files.
Computes mean and std deviation for each group and generates plots.
"""
if rmsd_config is None:
    rmsd_config = {}
if density_config is None:
    density_config = {}

def process_group(file_paths):
    times = []
    rmsd_vals = []
    for file in file_paths:
        time, rmsd = read_rmsd(file)
        if time is None or rmsd is None:
            raise ValueError(f"Error reading file: {file}. Please verify the file content.")
        times.append(time)
        rmsd_vals.append(rmsd)
    check_simulation_times(*times)
    mean_rmsd = np.mean(rmsd_vals, axis=0)
    std_rmsd = np.std(rmsd_vals, axis=0)
    return times[0], mean_rmsd, std_rmsd

results = []
for group in simulation_file_groups:
    if group:
        result = process_group(group)
        results.append(result)

if len(results) == 0:
    raise ValueError("You must provide at least one group of simulation files.")

plot_rmsd_all(results, output_folder, rmsd_config)
plot_density_all(results, output_folder, density_config)