System Temperature
Overview
DynamiSpectra offers a dedicated module for analyzing system temperature across molecular dynamics simulations using .xvg files. This module computes the mean temperature from multiple replicates and presents a time-series plot with the standard deviation as a shaded region, enabling assessment of temperature stability and fluctuations throughout the simulation.
Alongside the time-resolved analysis, DynamiSpectra also generates kernel density plots to depict the overall temperature distribution. These outputs help identify equilibration status, detect anomalies across replicates, and verify the maintenance of target temperatures under simulation conditions.
Command line in GROMACS to generate .xvg files for the analysis:
gmx energy -f Simulation.edr -o Termperature_simulation.xvg
def temperature_analysis(output_folder, *simulation_file_groups, temp_config=None, density_config=None)
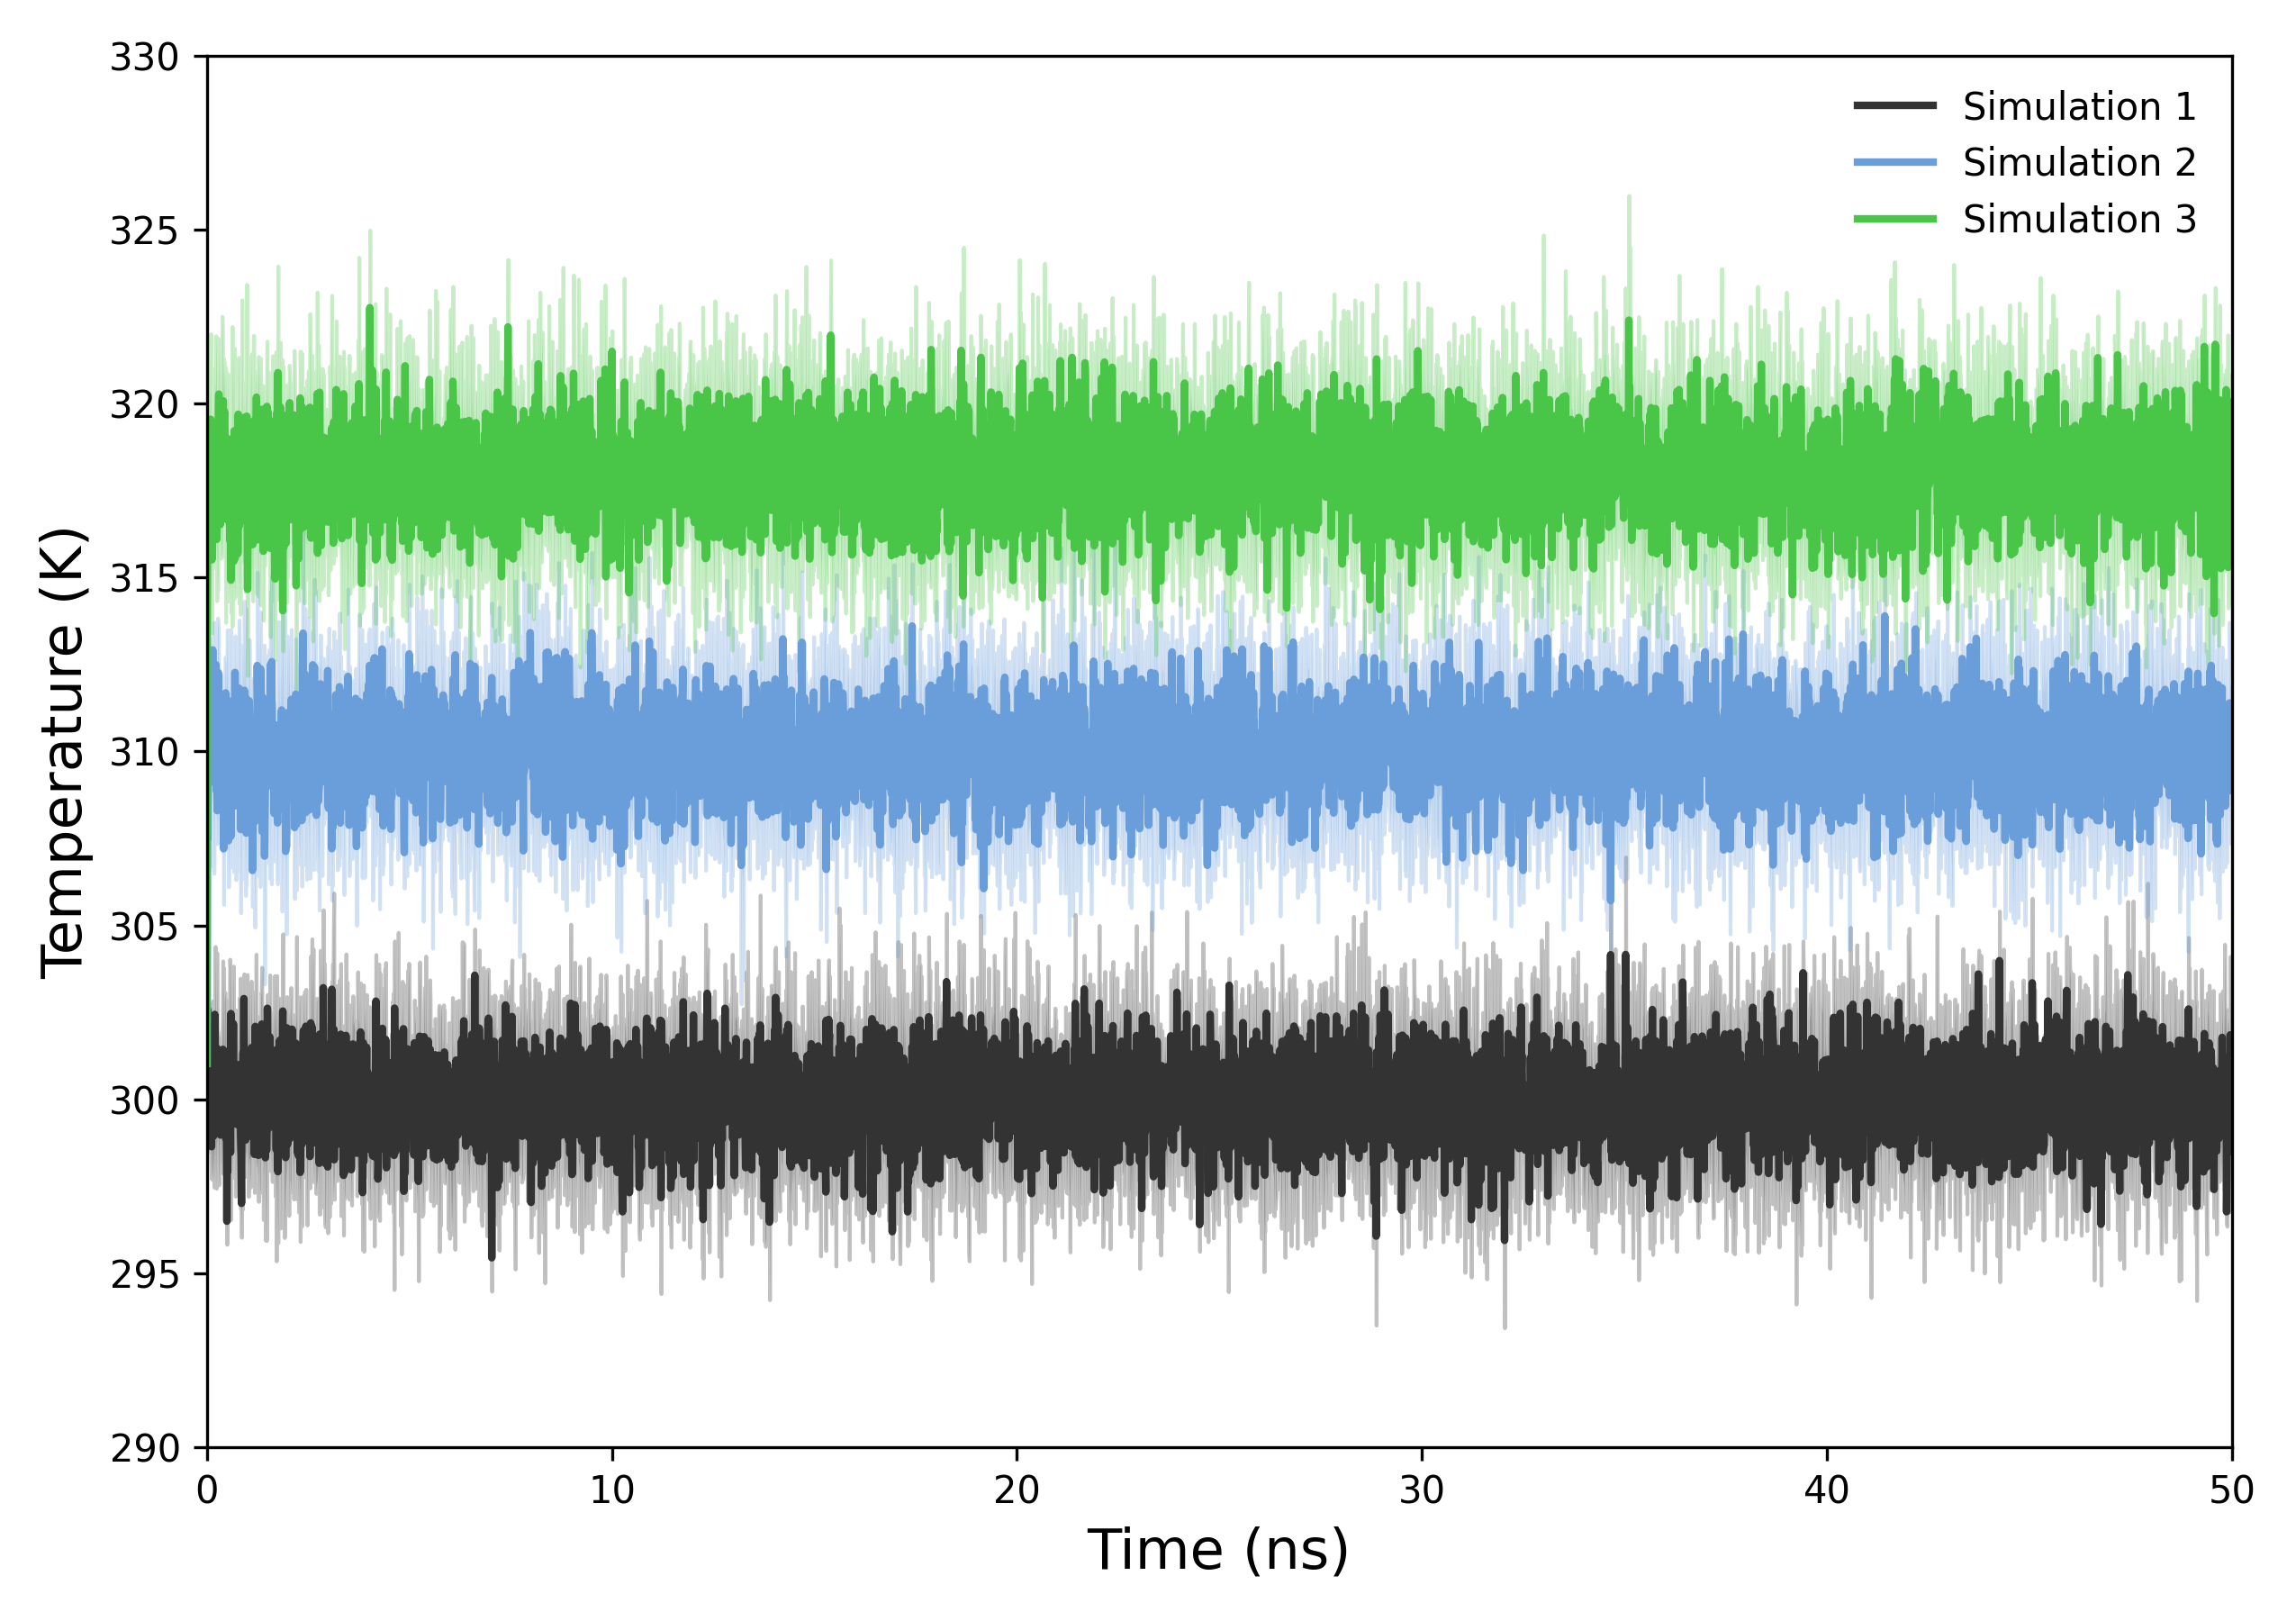
Interpretation guidance: The resulting plots show the temporal evolution of system temperature. A stable temperature profile indicates proper equilibration and control of the simulation ensemble. Significant fluctuations or trends may suggest insufficient thermal coupling, poor equilibration, or external perturbations affecting thermal stability.
def plot_temperature_density(results, output_folder, config=None)
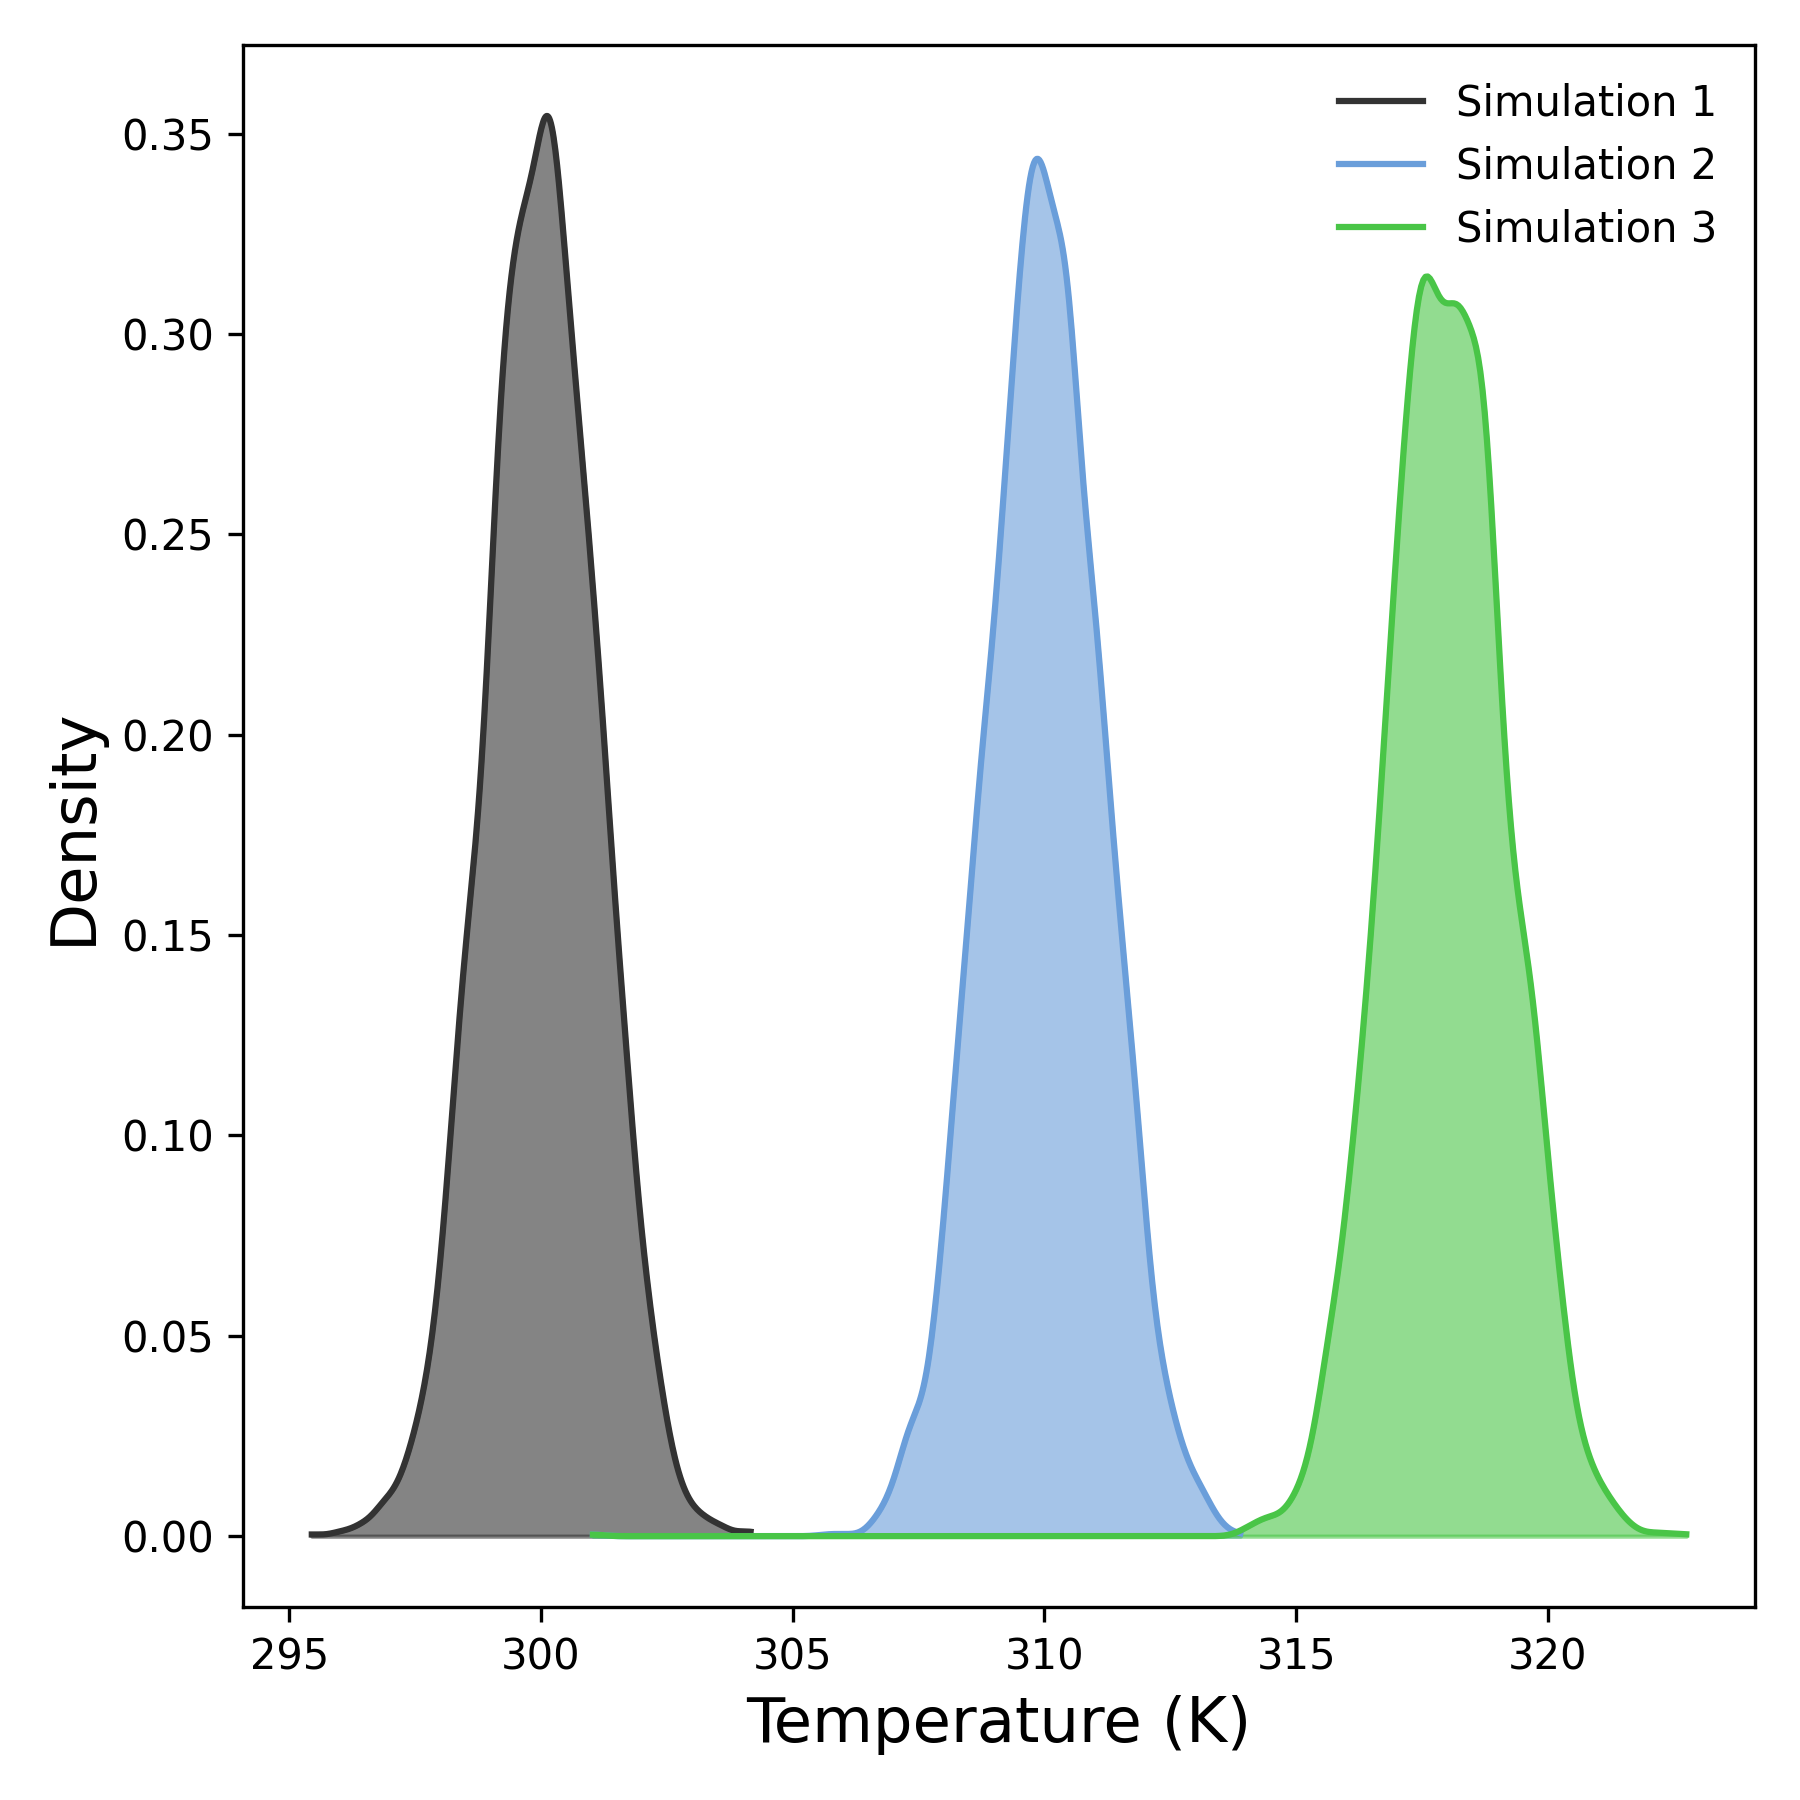
Interpretation guidance: This plot represents the distribution of temperature values throughout the simulation. Sharp, narrow peaks indicate stable and consistent thermal behavior, while broader peaks suggest greater variability or temperature fluctuations. Comparing distributions across simulations can help identify differences in thermal stability or ensemble control.
Complete code
import numpy as np
import matplotlib.pyplot as plt
from scipy.stats import gaussian_kde
import os
def read_temperature(file):
"""
Reads temperature data from a .xvg file and returns time (in ns) and temperature values.
"""
try:
    times = []
    temps = []
    with open(file, 'r') as f:
        for line in f:
            # Skip comments and empty lines
            if line.startswith(('#', '@', ';')) or line.strip() == '':
                continue
            try:
                values = line.split()
                if len(values) >= 2:
                    time_ps, temp_val = map(float, values[:2])
                    times.append(time_ps / 1000.0)  # Convert ps to ns
                    temps.append(temp_val)
            except ValueError:
                # Skip lines with parsing errors
                continue
    if len(times) == 0 or len(temps) == 0:
        raise ValueError(f"File {file} does not contain valid data.")
    return np.array(times), np.array(temps)
except Exception as e:
    print(f"Error reading file {file}: {e}")
    return None, None
def check_simulation_times(*time_arrays):
for i in range(1, len(time_arrays)):
    if not np.allclose(time_arrays[0], time_arrays[i]):
        raise ValueError(f"Simulation times do not match between file 1 and file {i+1}")
def plot_temperature(results, output_folder, config=None):
plt.figure(figsize=config.get('figsize', (9, 6)))

# Loop over each simulation group's results
for idx, (time, mean, std) in enumerate(results):
    label = config['labels'][idx] if config and 'labels' in config else f'Simulation {idx+1}'
    color = config['colors'][idx] if config and 'colors' in config else None
    alpha = config.get('alpha', 0.2) if config else 0.2

    # Plot mean temperature line
    plt.plot(time, mean, label=label, color=color, linewidth=2)
    # Fill area between mean ± std deviation
    plt.fill_between(time, mean - std, mean + std, color=color, alpha=alpha)

# Set axis labels and font sizes
plt.xlabel(config.get('xlabel', 'Time (ns)'), fontsize=config.get('label_fontsize', 12))
plt.ylabel(config.get('ylabel', 'Temperature (K)'), fontsize=config.get('label_fontsize', 12))

plt.legend(frameon=False, loc='upper right', fontsize=10)
plt.tick_params(axis='both', which='major', labelsize=10)

# Set x-axis limits from 0 to max time
max_time = max([np.max(time) for time, _, _ in results])
plt.xlim(0, max_time)
# Set fixed y-axis range for temperature visualization
plt.ylim(290, 310)

plt.tight_layout()
os.makedirs(output_folder, exist_ok=True)
plt.savefig(os.path.join(output_folder, 'temperature_plot.tiff'), dpi=300)
plt.savefig(os.path.join(output_folder, 'temperature_plot.png'), dpi=300)
plt.show()
def plot_temperature_density(results, output_folder, config=None):
plt.figure(figsize=config.get('figsize', (6, 6)))

# Loop over each simulation group's mean temperature for KDE
for idx, (_, mean, _) in enumerate(results):
    kde = gaussian_kde(mean)
    x_vals = np.linspace(290, 310, 1000)  # Define KDE evaluation range
    label = config['labels'][idx] if config and 'labels' in config else f'Simulation {idx+1}'
    color = config['colors'][idx] if config and 'colors' in config else None
    alpha = config.get('alpha', 0.5) if config else 0.5

    # Plot filled KDE curve
    plt.fill_between(x_vals, kde(x_vals), color=color, alpha=alpha, label=label)

# Set axis labels and font sizes
plt.xlabel(config.get('xlabel', 'Temperature (K)'), fontsize=config.get('label_fontsize', 12))
plt.ylabel(config.get('ylabel', 'Density'), fontsize=config.get('label_fontsize', 12))

plt.legend(frameon=False, loc='upper right', fontsize=10)
plt.tight_layout()
os.makedirs(output_folder, exist_ok=True)
plt.savefig(os.path.join(output_folder, 'temperature_density.tiff'), dpi=300)
plt.savefig(os.path.join(output_folder, 'temperature_density.png'), dpi=300)
plt.show()
def temperature_analysis(output_folder, *simulation_file_groups, temp_config=None, density_config=None):
"""
Processes multiple groups of temperature replicates, calculates mean and std, and plots results.

Parameters:
- output_folder: str, directory to save plots
- simulation_file_groups: lists of replicate file paths for each simulation group
- temp_config: dict (optional), plot config for time series
- density_config: dict (optional), plot config for KDE density
"""
results = []

# Process each simulation group (each group has multiple replicate files)
for group in simulation_file_groups:
    if group:
        times = []
        temps = []
        for file in group:
            time, temp_val = read_temperature(file)
            if time is None or temp_val is None:
                raise ValueError(f"Error reading file: {file}")
            times.append(time)
            temps.append(temp_val)
        # Check that all replicates have matching time arrays
        check_simulation_times(*times)
        temps_array = np.array(temps)
        mean_temp = np.mean(temps_array, axis=0)
        std_temp = np.std(temps_array, axis=0)
        results.append((times[0], mean_temp, std_temp))

# Plot results if any simulation groups were processed
if len(results) >= 1:
    plot_temperature(results, output_folder, config=temp_config)
    plot_temperature_density(results, output_folder, config=density_config)
else:
    raise ValueError("At least one simulation group is required.")